

Pipelines generate a number of forms of output data:
These are presented in the Outputs Summary, accessed by clicking on the Outputs heading.
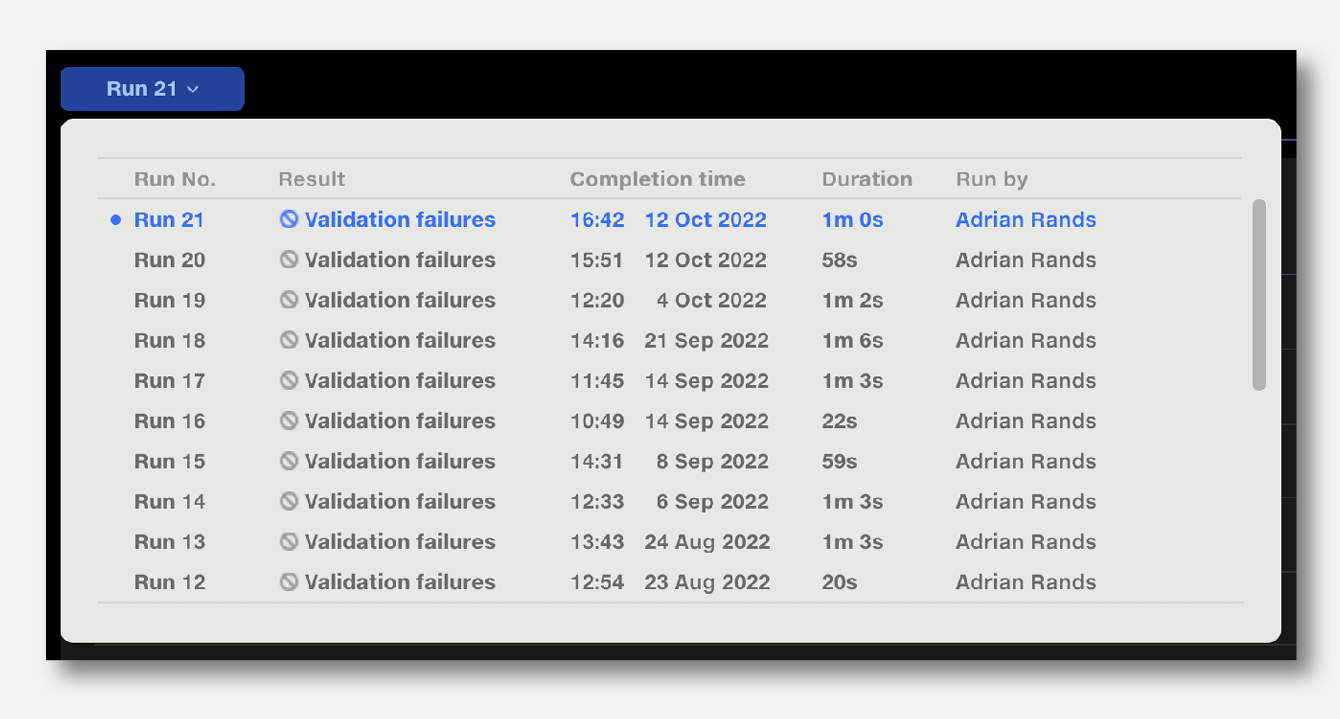
The status of the displayed run is displayed next to the Run History popup.

The Run Number button indicates the current run number. Clicking the button opens the Run History popup, showing details of previous runs. Click on a previous run to navigate to its outputs.
Whilst the pipeline is running it displays run time elapsed.
When the run ends it displays the total run time, alongside whether the run was successful, or encountered an error and failed.
If the pipeline was Auto Run, the inputs which triggered the run are listed.
The Run Log popup lists the events occurring during a run, allowing you to monitor progress during the run and check the duration of each stage. The Run Log popup also lists the pipeline revision number that a run was initiated from, and who ran the pipeline.
If the pipeline was Auto Run, the inputs which triggered the run are listed.
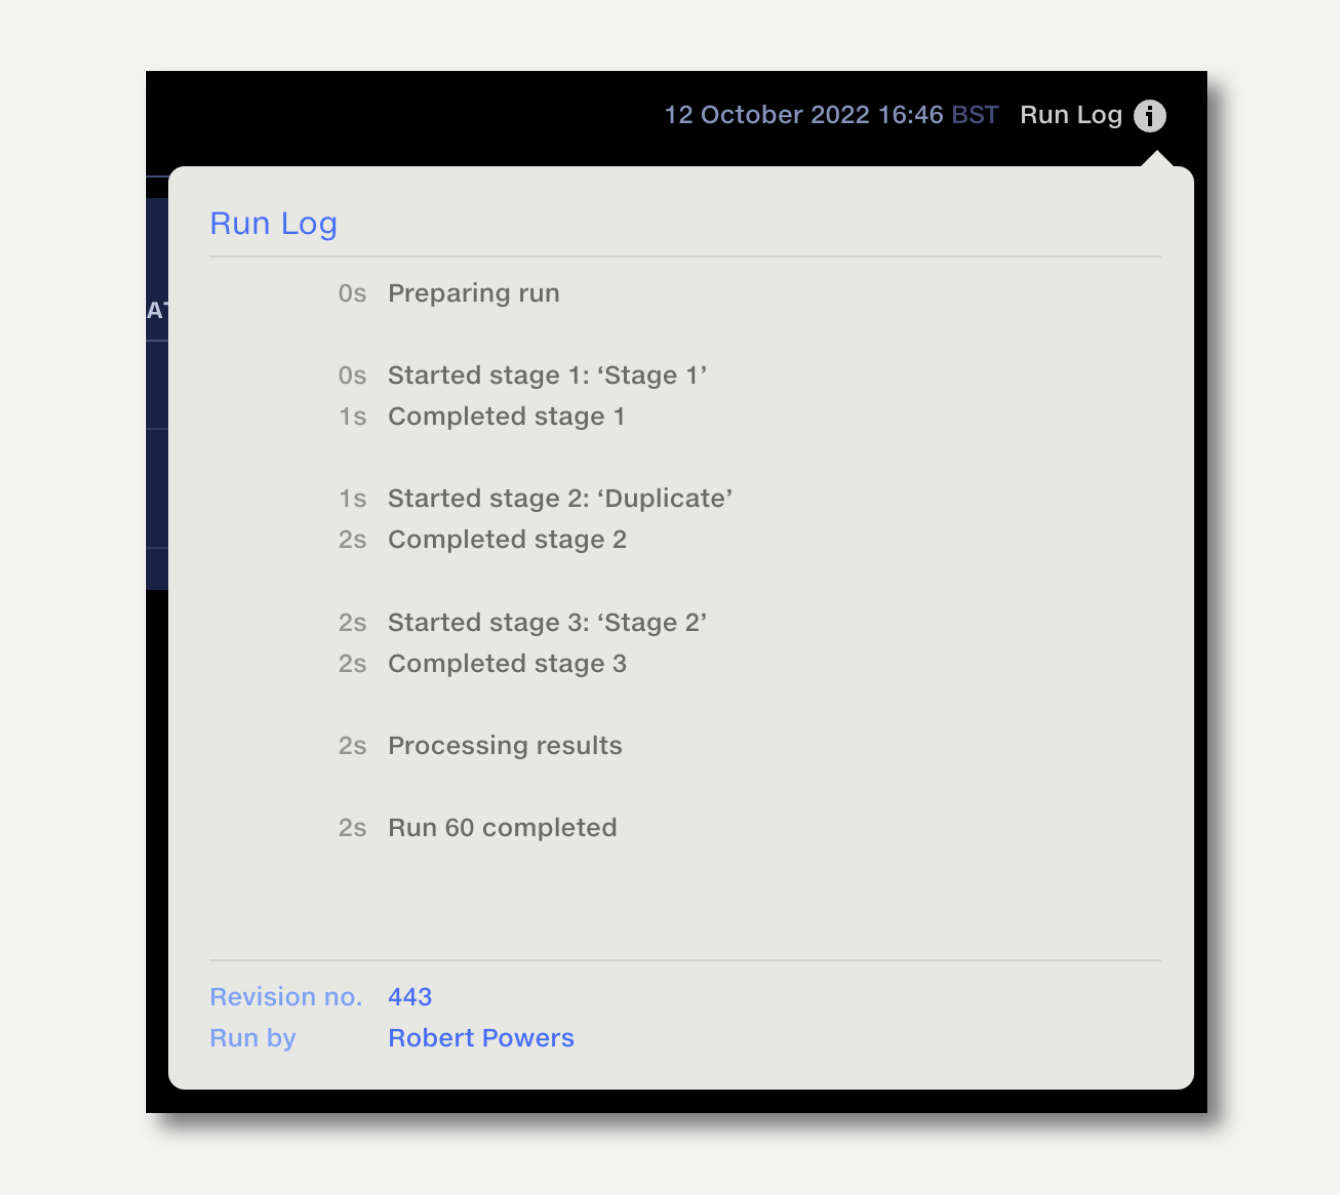
If an error occurs at run time, it will be reported in the Run Status bar, with details of the error in the Run Log popup.
There are two classes of run error:
If Validate operations have been used in the pipeline, a summary of the results of each validation operation will be displayed.
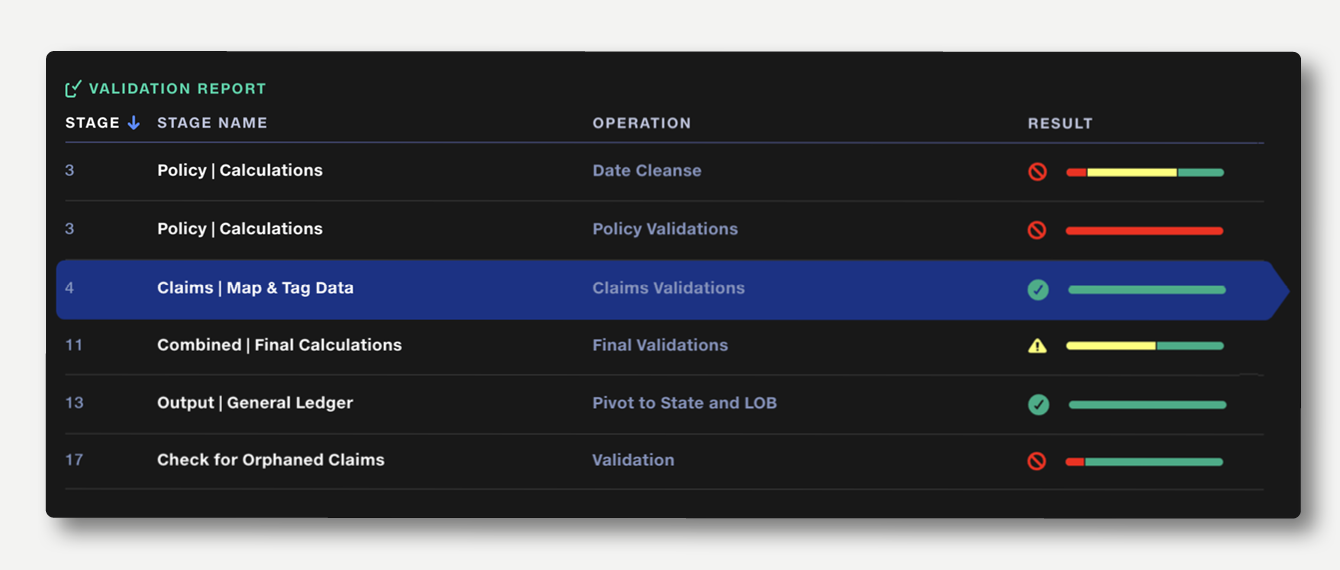
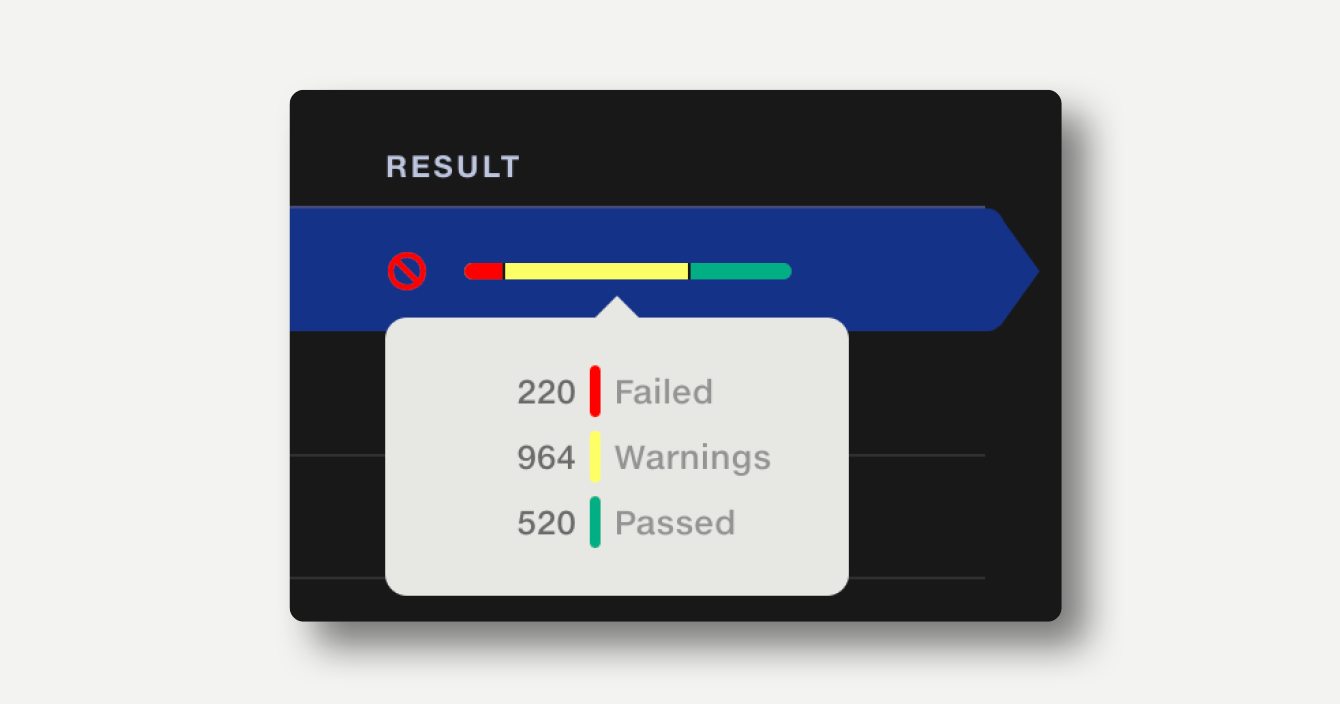
The summary bar shows the proportion of rows passed, rows with warnings and rows with failures. If a validation rule returns a failure or warning, this is indicated with an icon in the result column. Hover over the summary bar to see the number rows passed, failed or warned.
Click on a summary result to view the full Validation Report.
By default, the results are sorted in the order in which they appear in the pipeline. Results can also be sorted by stage name, operation name or result.
If Automap Values operations have been used in the pipeline, a summary of the operations used will be displayed.
In the outputs view, the mappings column lists the number of distinct values input to the operation and the number of distinct values output.
In the example below, 90,533 distinct values were input and 25,760 values were output.
Note that unmatched items can be set to map to a single value, which will affect the number of output values.
The summary bar shows the proportion of rows which are mapped, automapped and unmapped. Hover over the summary bar to see the number of rows for each category.
In the example below, 3 rows were already approved, 64,772 were automapped and 25,758 were unmatched.
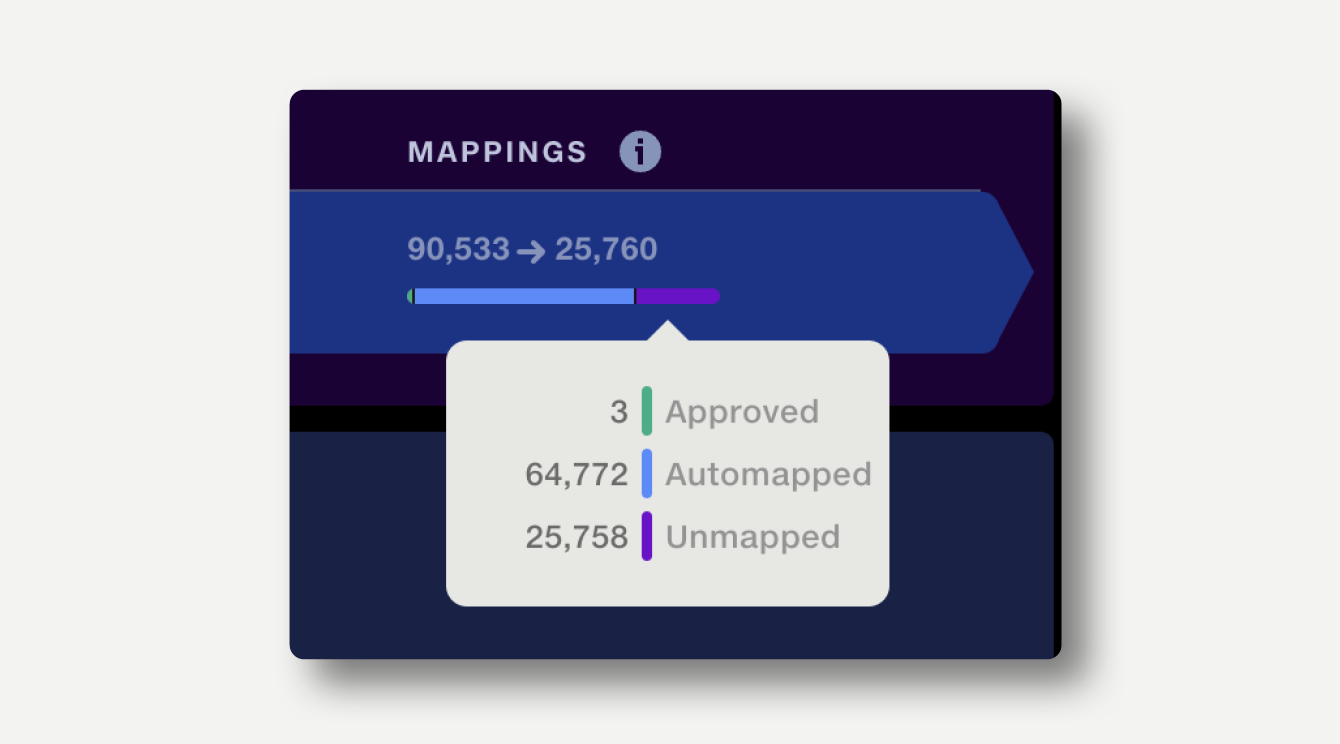
Click on an item in the summary to view the full Mapping Report, detailing each mapping and allowing it to be approved for future runs.
By default, the results are sorted in the order in which they appear in the pipeline. Results can also be sorted by stage name or operation name.
The Data Repo is the storage area for clean datasets and reference data in Quantemplate. Pipeline output datasets can be exported to the data repo to be made available for Analyse reporting, or to trigger export to another system via API.
Stage outputs which have been made exportable are displayed alongside their row count, export destination and export status.
Output datasets which have been exported can be externally shared with partner organisations. Externally shared datasets are indicated by the green heads icon. Learn more about partner sharing.
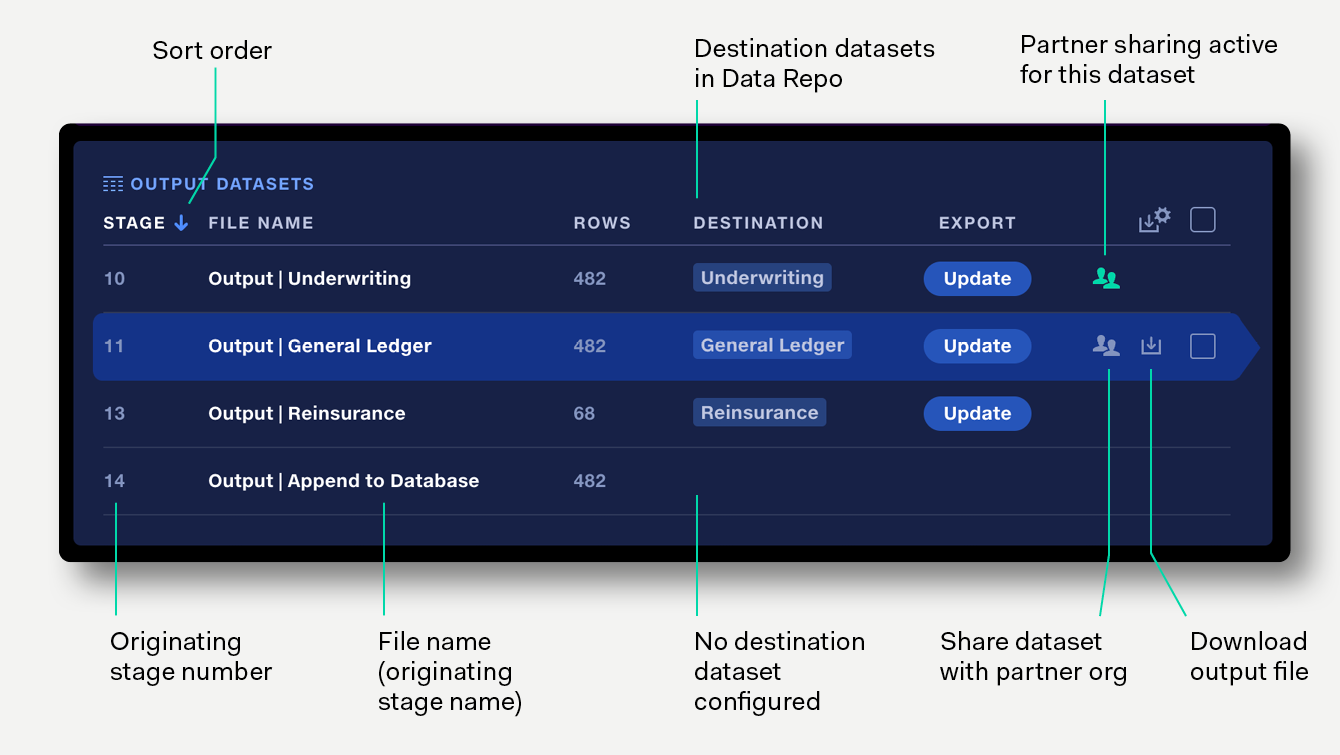
Click on an item in the output datasets list to navigate to a preview of the dataset.
Apply filters to the output data preview to understand your data better.
Export pipeline outputs to the Data repo to share them more widely within the organisation, explore the data in Analyse, or share via API.
To export an output to the data repo, first ensure it has been made exportable by toggling on in the stage outputs. It will then appear in the Output Datasets list.
To export directly from the output datasets list:
If a destination dataset has been created but is no longer available, due to being archived or the user not having permission, this will be highlighted in red. To resolve this, either select a different dataset, or click the warning icon to open a popup and unarchive the dataset or grant the user permission to edit the dataset.
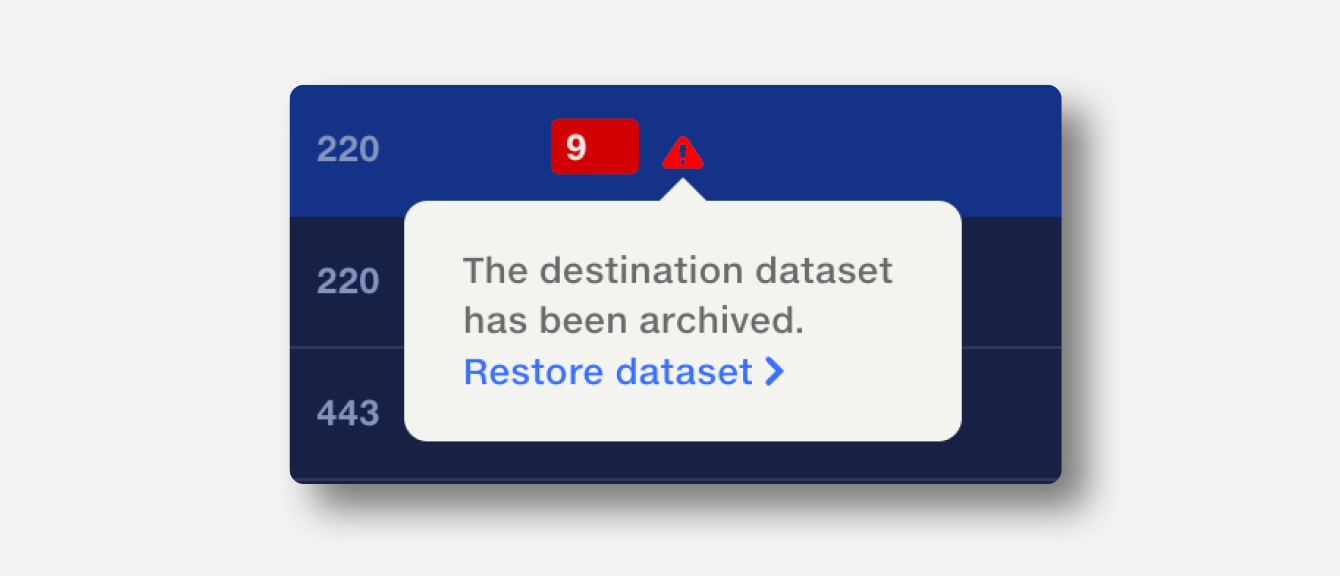
If the same destination dataset has been selected for multiple pipeline outputs, each instance will be highlighted red. To resolve this, select a unique destinations for each output, or if any of the affected outputs are no longer needed, make them non-exportable in the stage outputs.

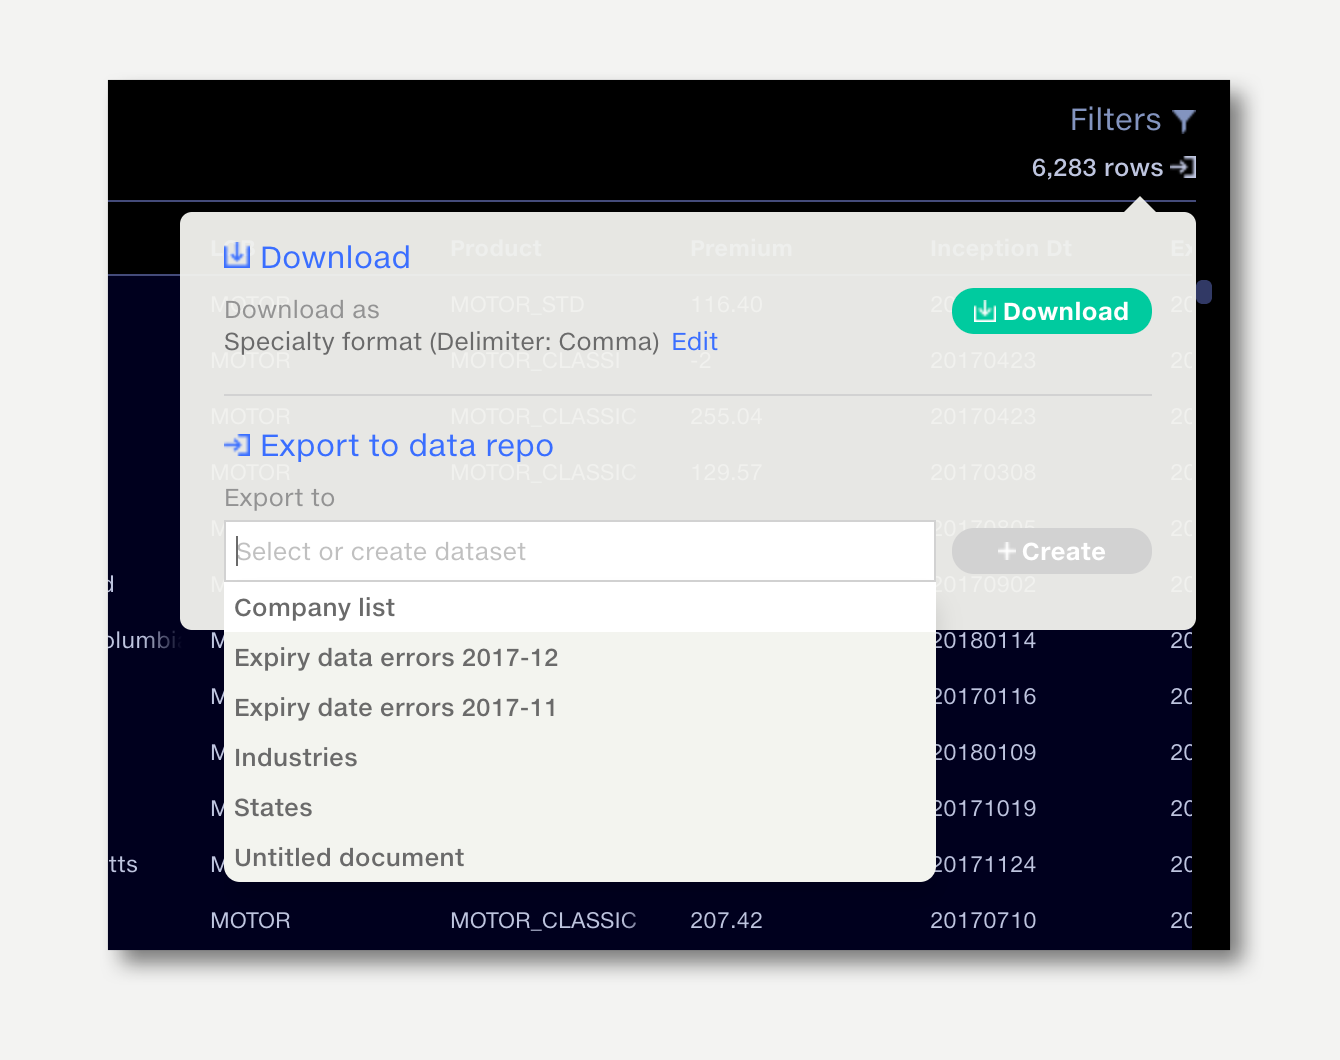
Individual outputs can also be exported to the data repo from the output preview by clicking on the export/download button on the top right.
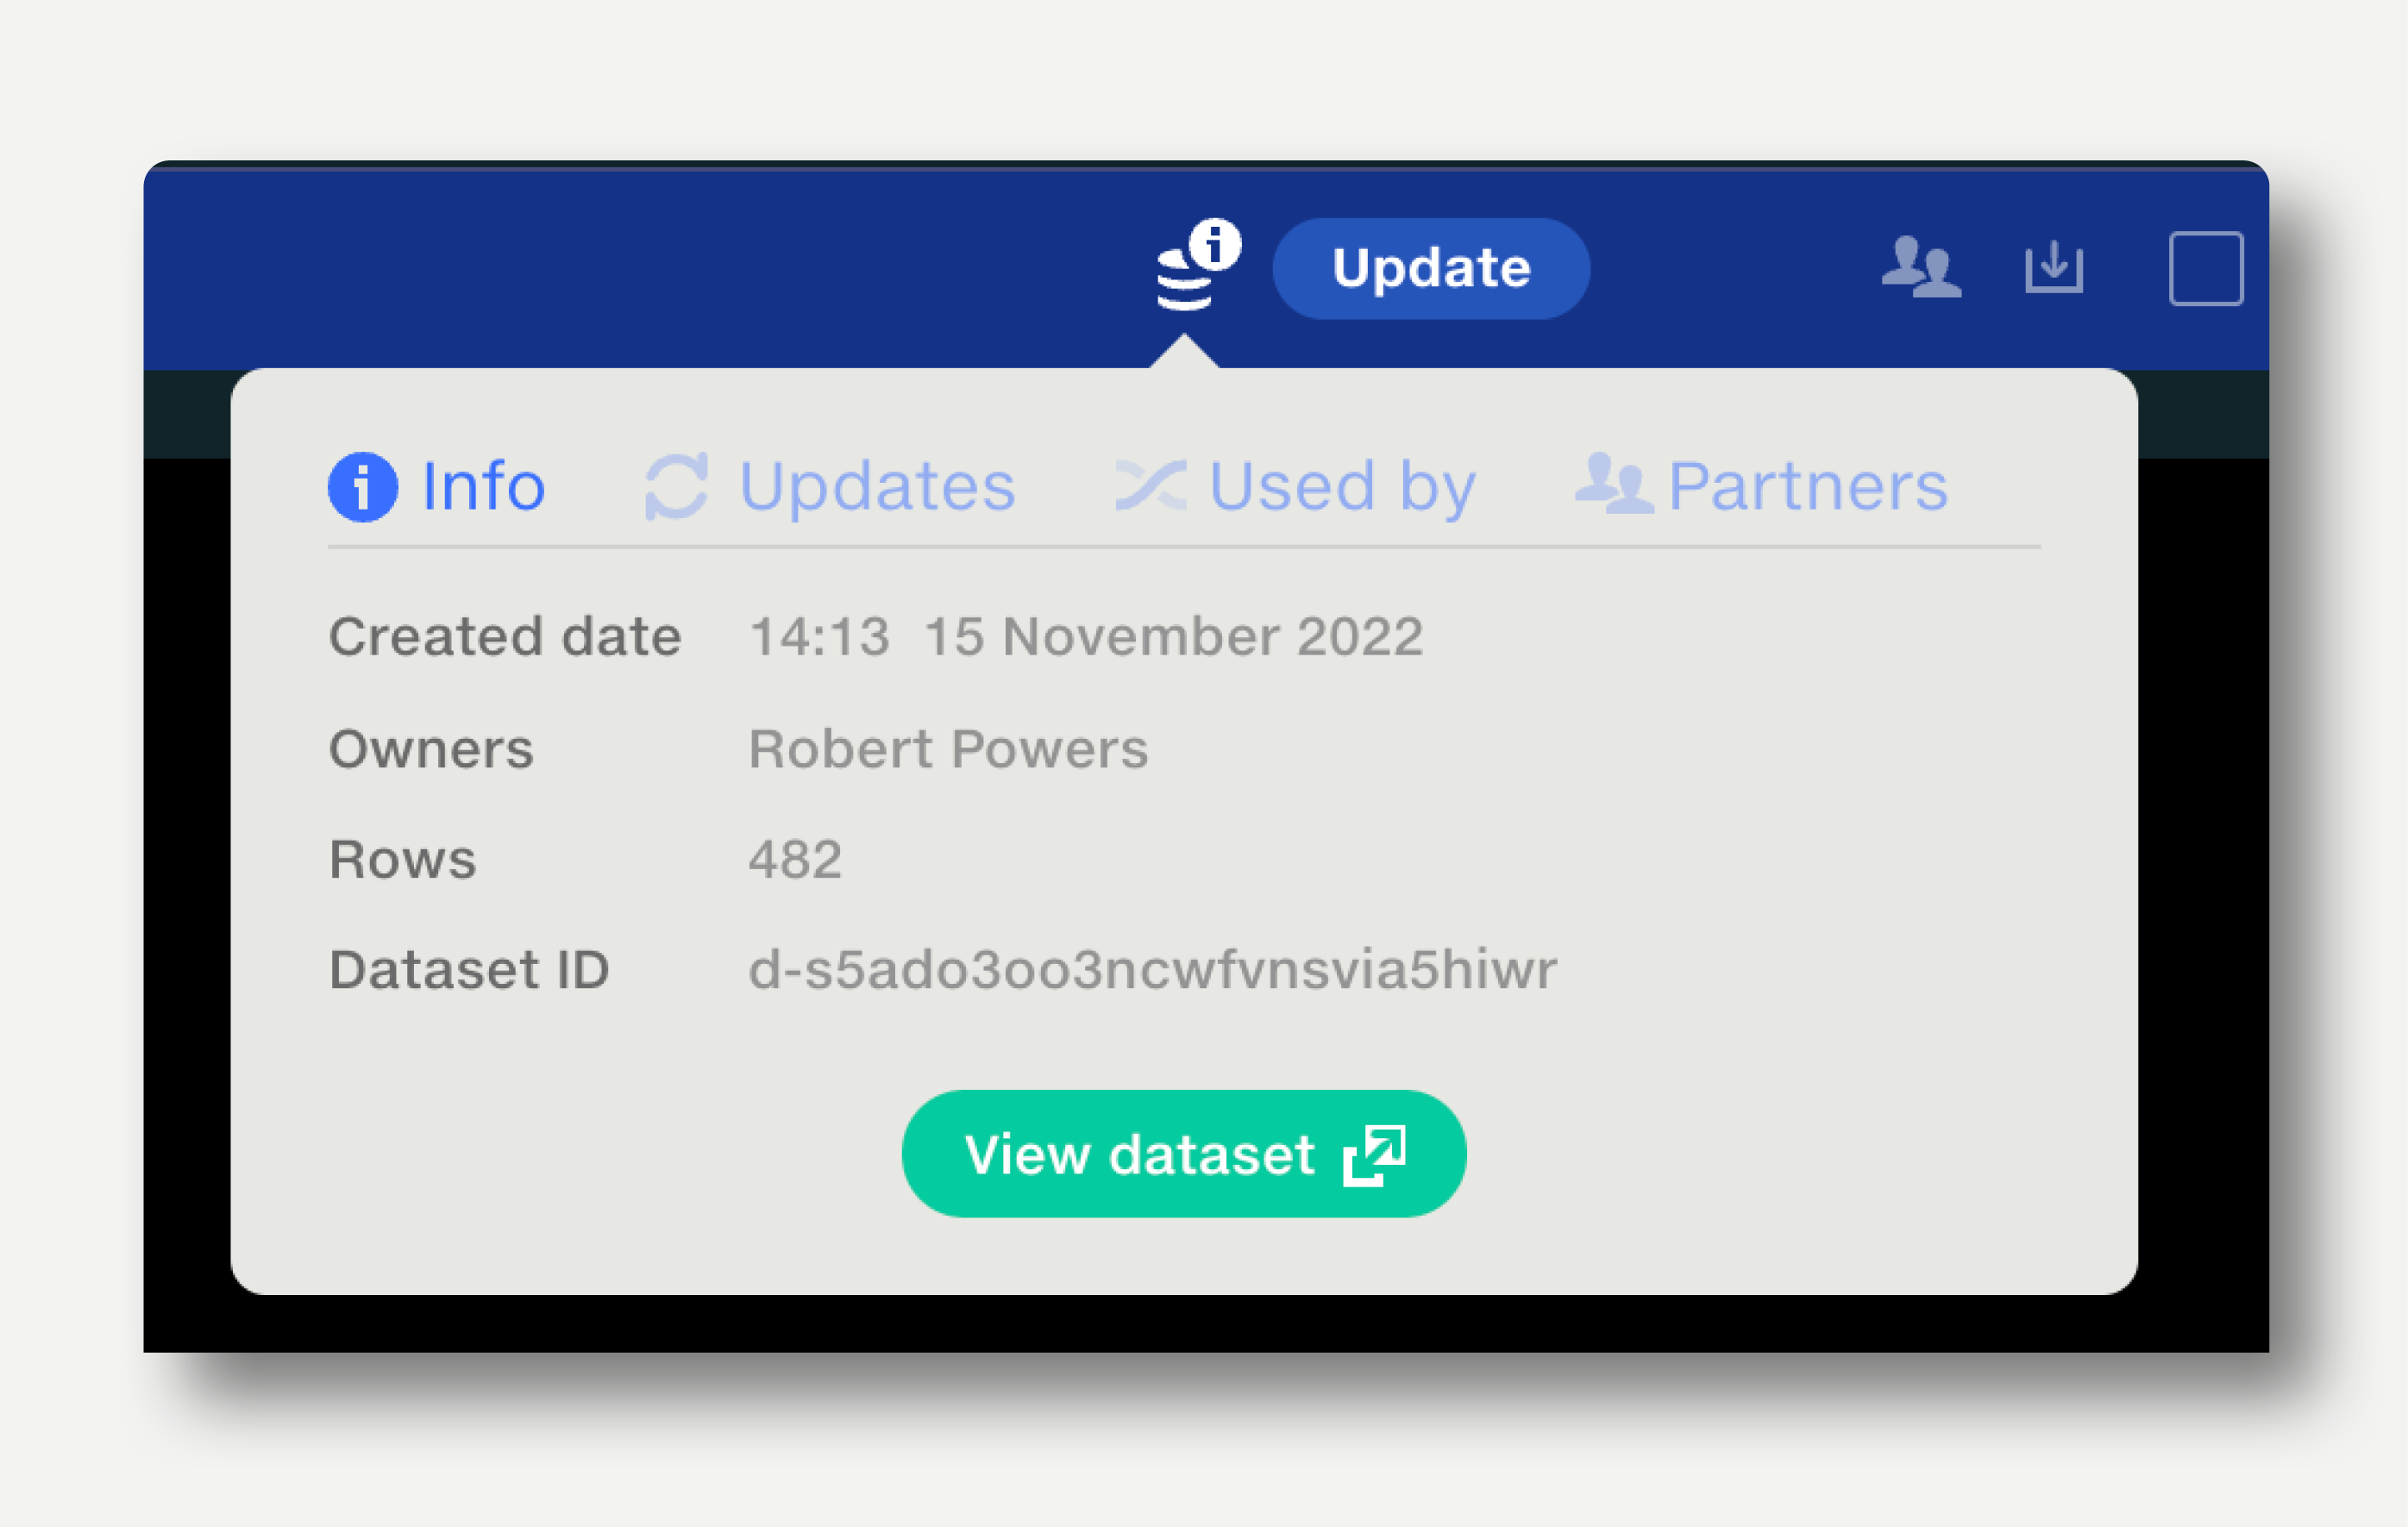
The Dataset Information popup shows information about how a dataset has been created and updated, and where it is used as a reference dataset. Read more about it here.
To download an output from the Output Datasets list, hover over the output and click the download button which appears on the right.
To download an output from the dataset preview, click on the the export/download button on the top right.
The default download format is Comma Separated Values (CSV) in standard configuration. To change the download file format from the Output Datasets list, click the download settings button on the top right of the table and select the preferred format.
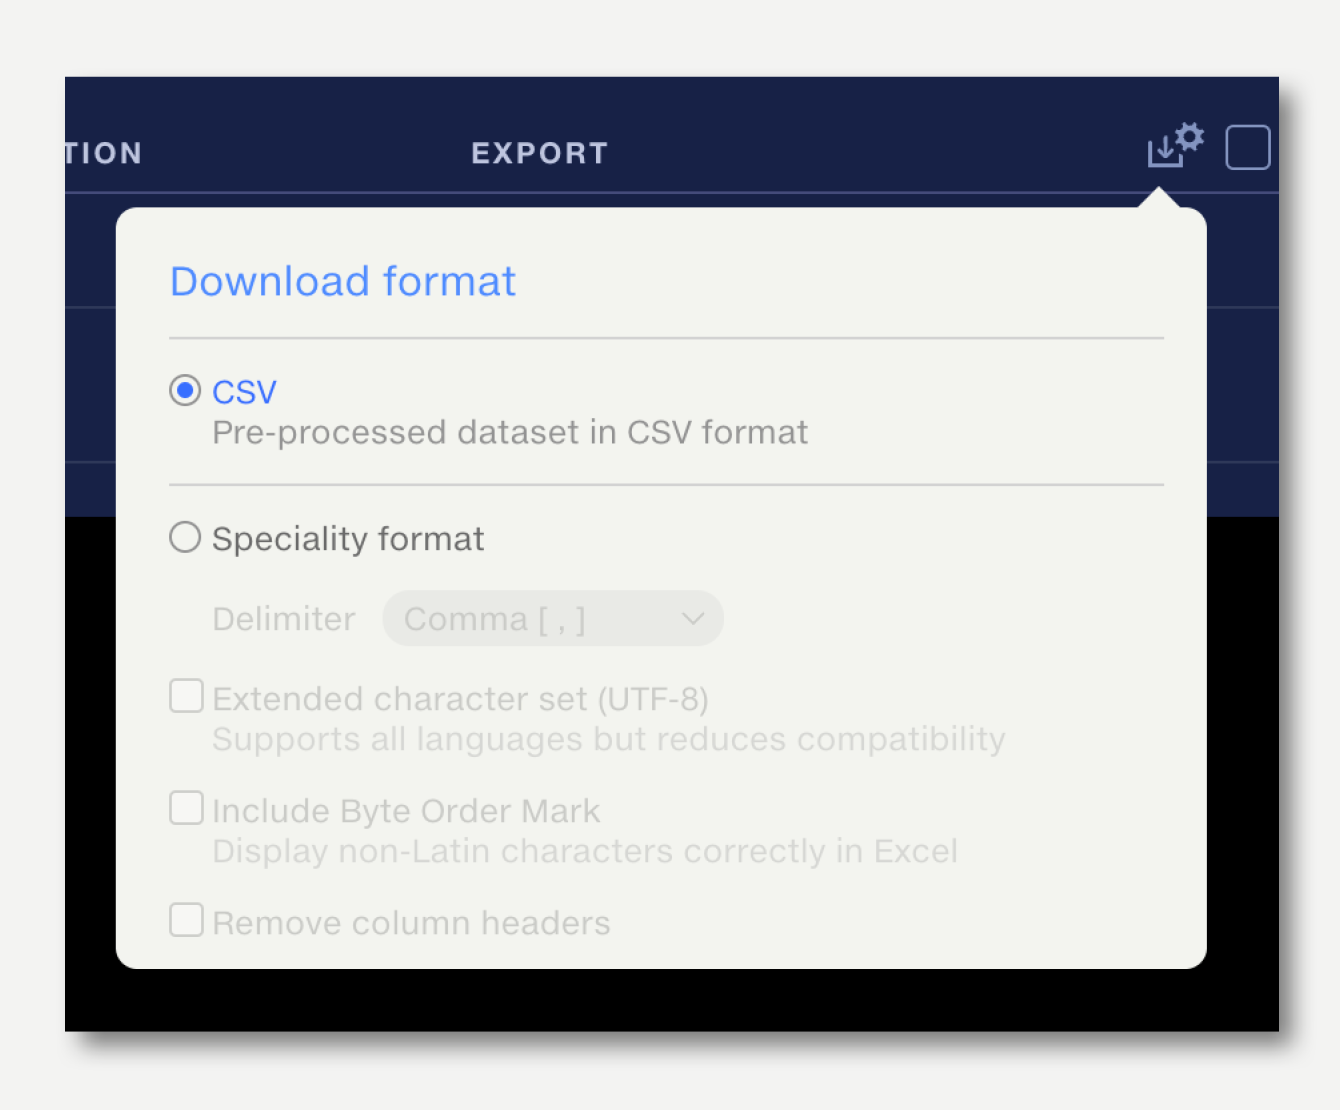
To change the download file format from the Dataset preview, click the edit button in the export/download popup. The selected format will be remembered as the default for all outputs of this pipeline.
File format |
Extension |
Description |
CSV |
.csv |
Standard Comma Separated Values format. |
Speciality formats |
||
Delimiter |
Select your preferred delimiter character.
To support different regional number formatting settings in Excel, change the delimiter to semicolon.
|
|
Comma |
.csv |
, |
Semicolon |
.csv |
; |
Pipe |
.csv |
| |
Tab |
.txt |
⇥ |
Extended character set (UTF-8) |
.csv .txt |
Extended character set (UTF-8) support may be required if your data contains characters outside the ASCII character set.
This is likely to be the case with accented characters, special punctuation or non-Latin alphabets.
Selecting UTF-8 may reduce compatability with other systems.
To format a file containing special characters for use in Excel, select UTF-8 and Include Byte Order Mark (below).
|
Include Byte Order Mark |
.csv .txt |
A Byte Order Mark is a set of characters prepended to the data to inform Excel which character encoding has been used and so how special characters should be displayed.
Select this option, plus UTF-8 (above), to use data containing special characters in Excel.
Note that compatability with other systems may be reduced when this option is selected.
|
The download format can also be set from the export download popup in the dataset preview.
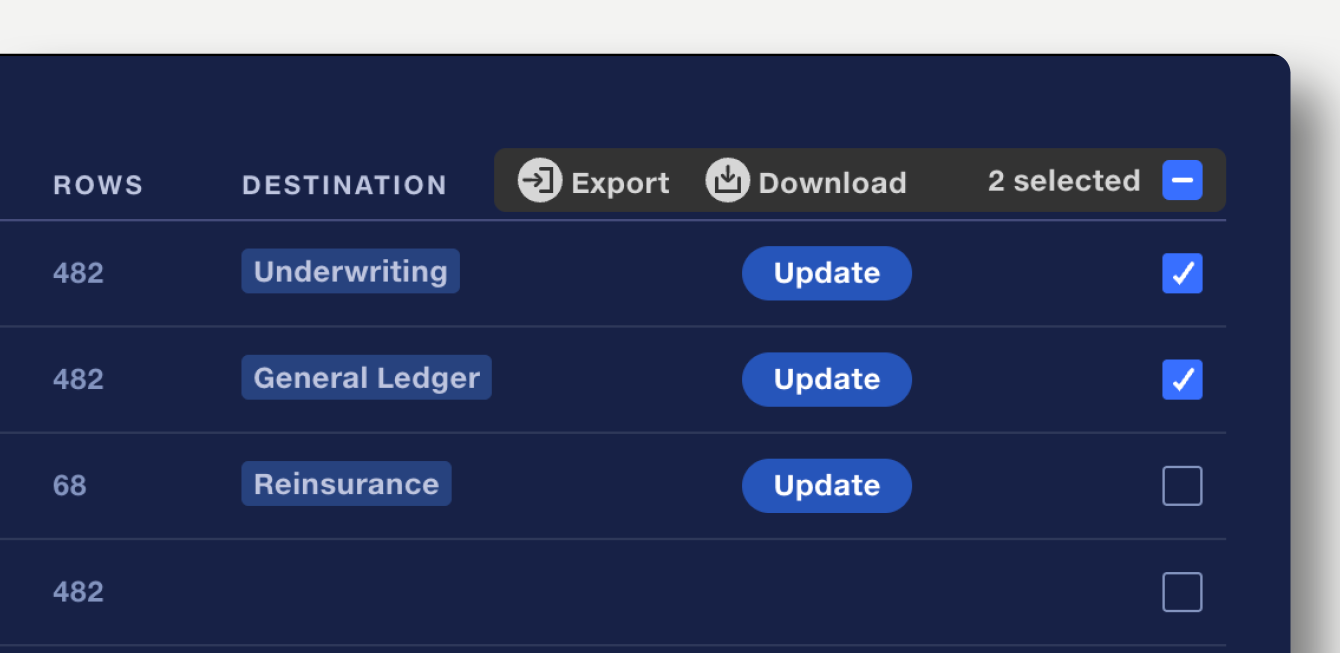
To download or export multiple datasets at once, select the datasets using the checkboxes on the right. Click download or export in the batch action bar which appears on the top right.
Only datasets with valid destinations will be exported. If multiple datasets use the same destination, these will be skipped.
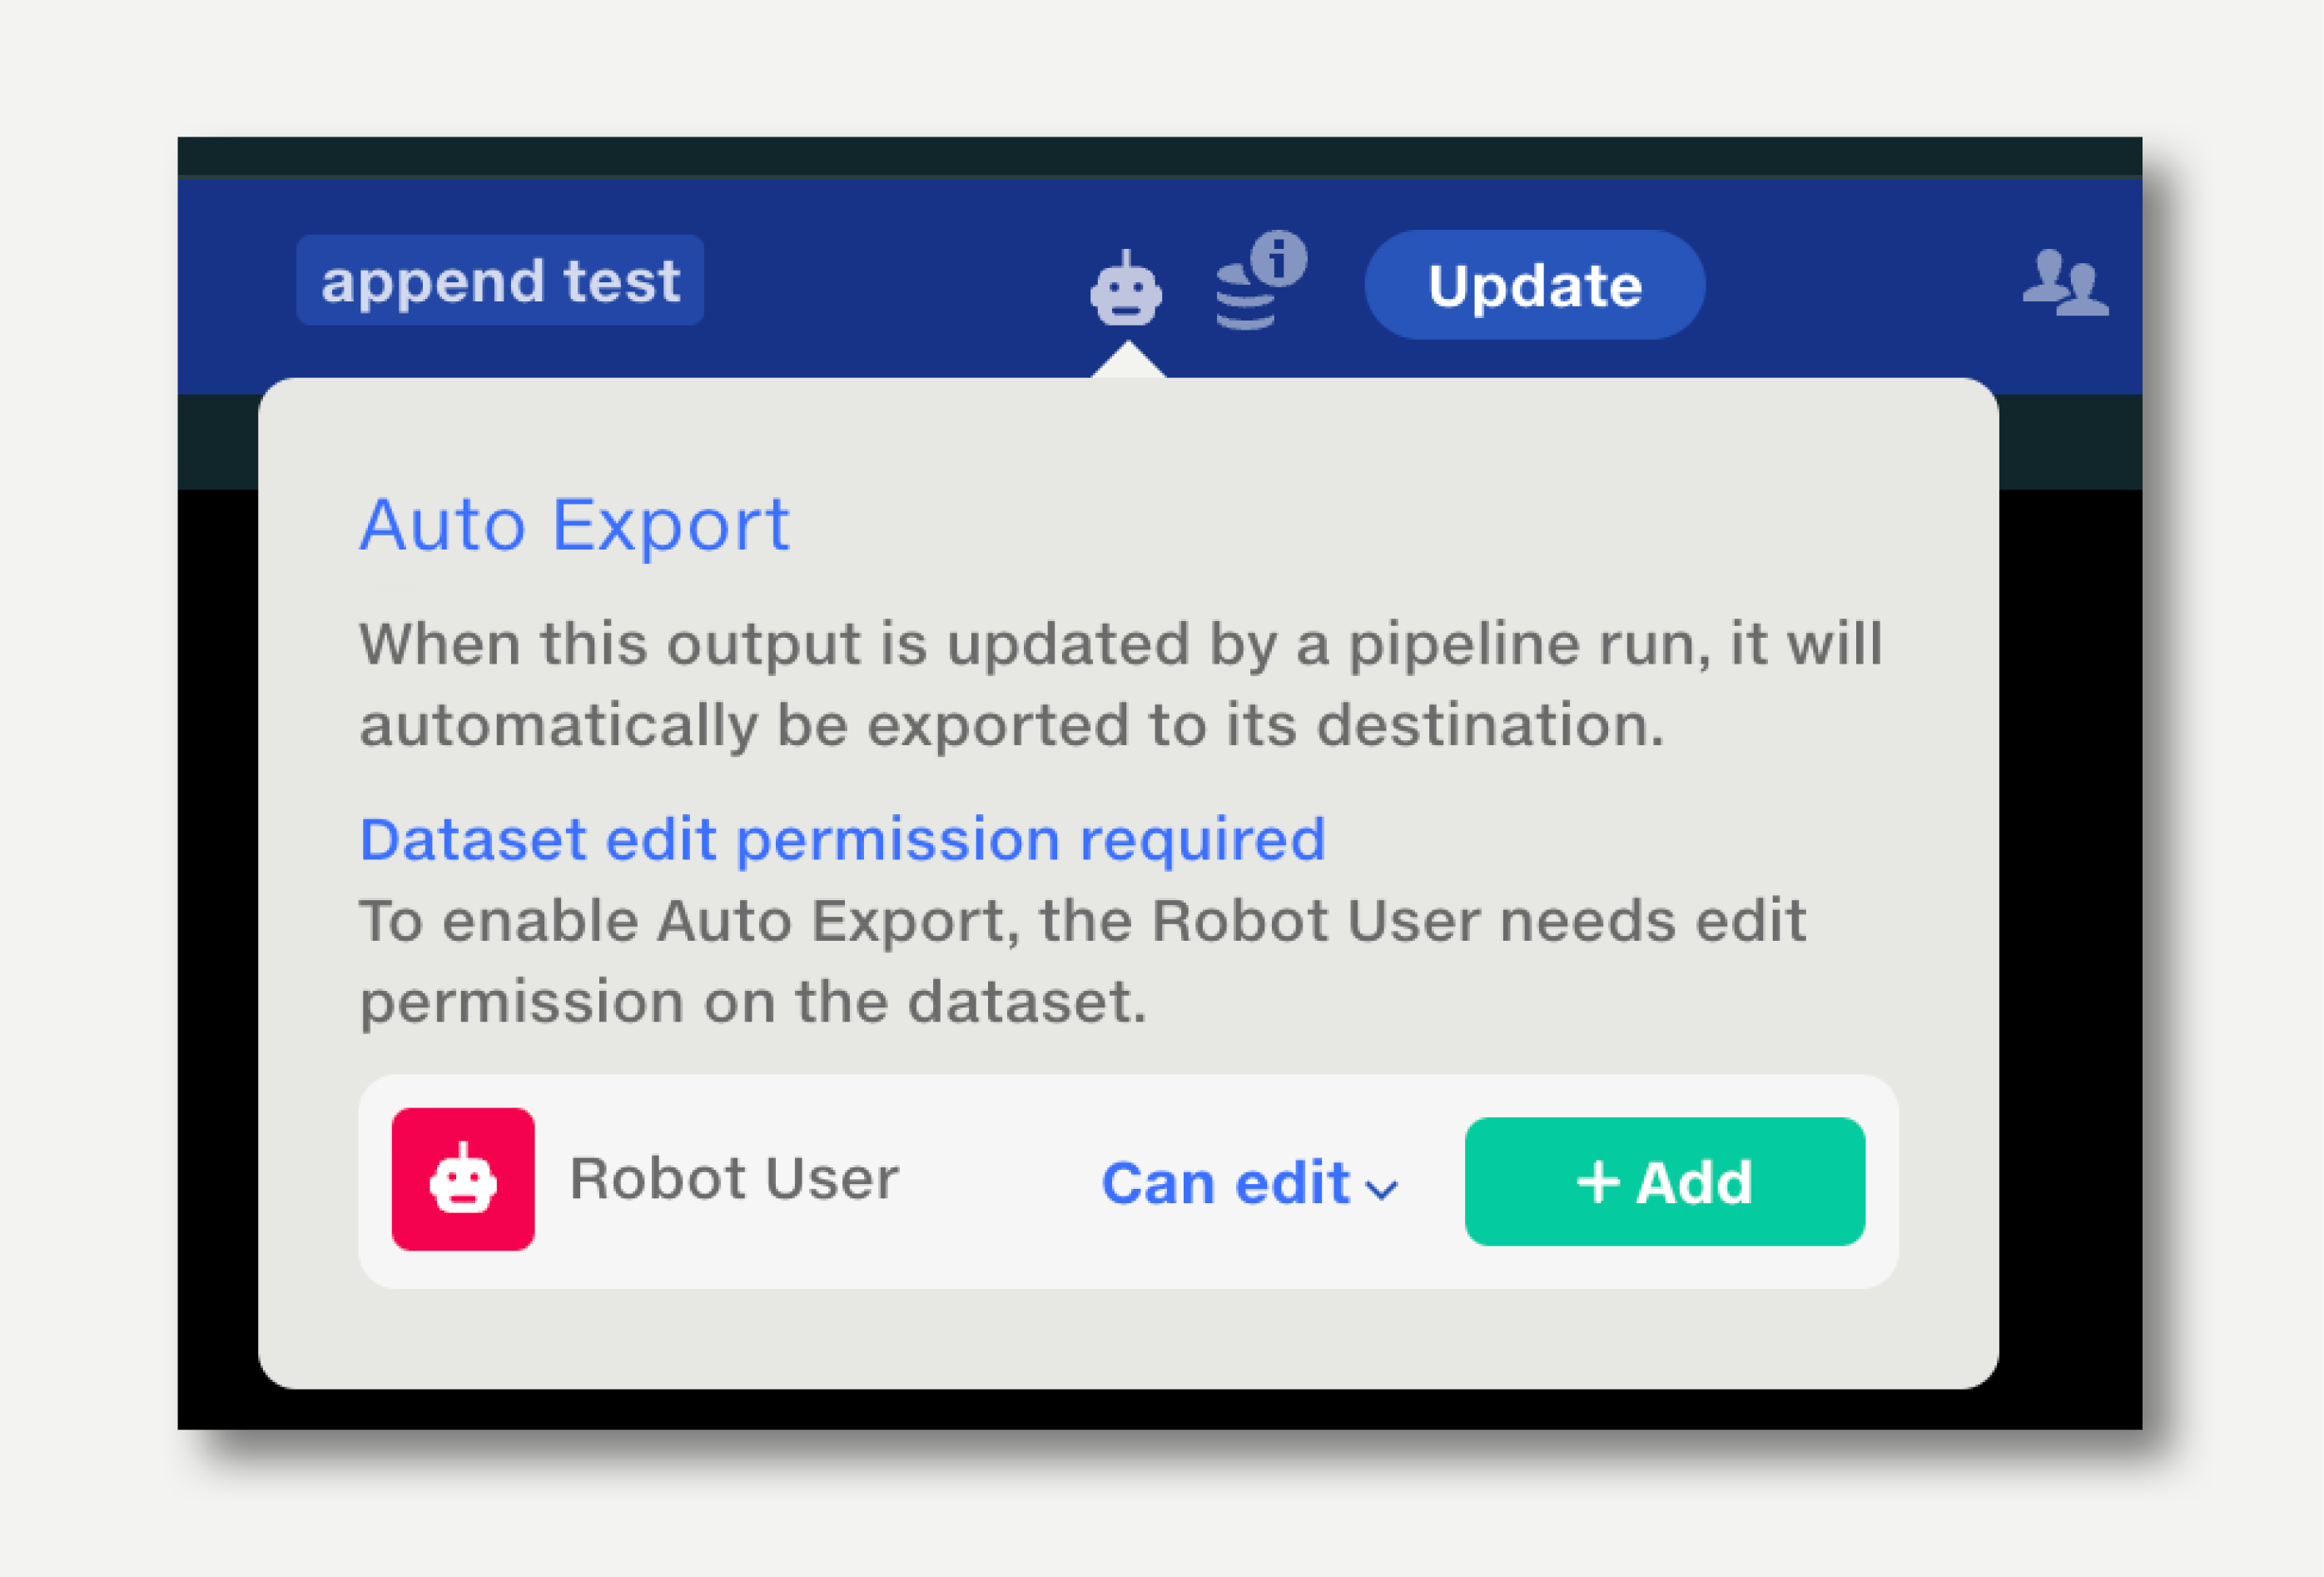
Auto Export enables straight-through processing of data – for example: insurance risk and claims bordereaux, catastrophe risk modelling portfolios, treaty reinsurance submissions – as part of a complete automation workflow.
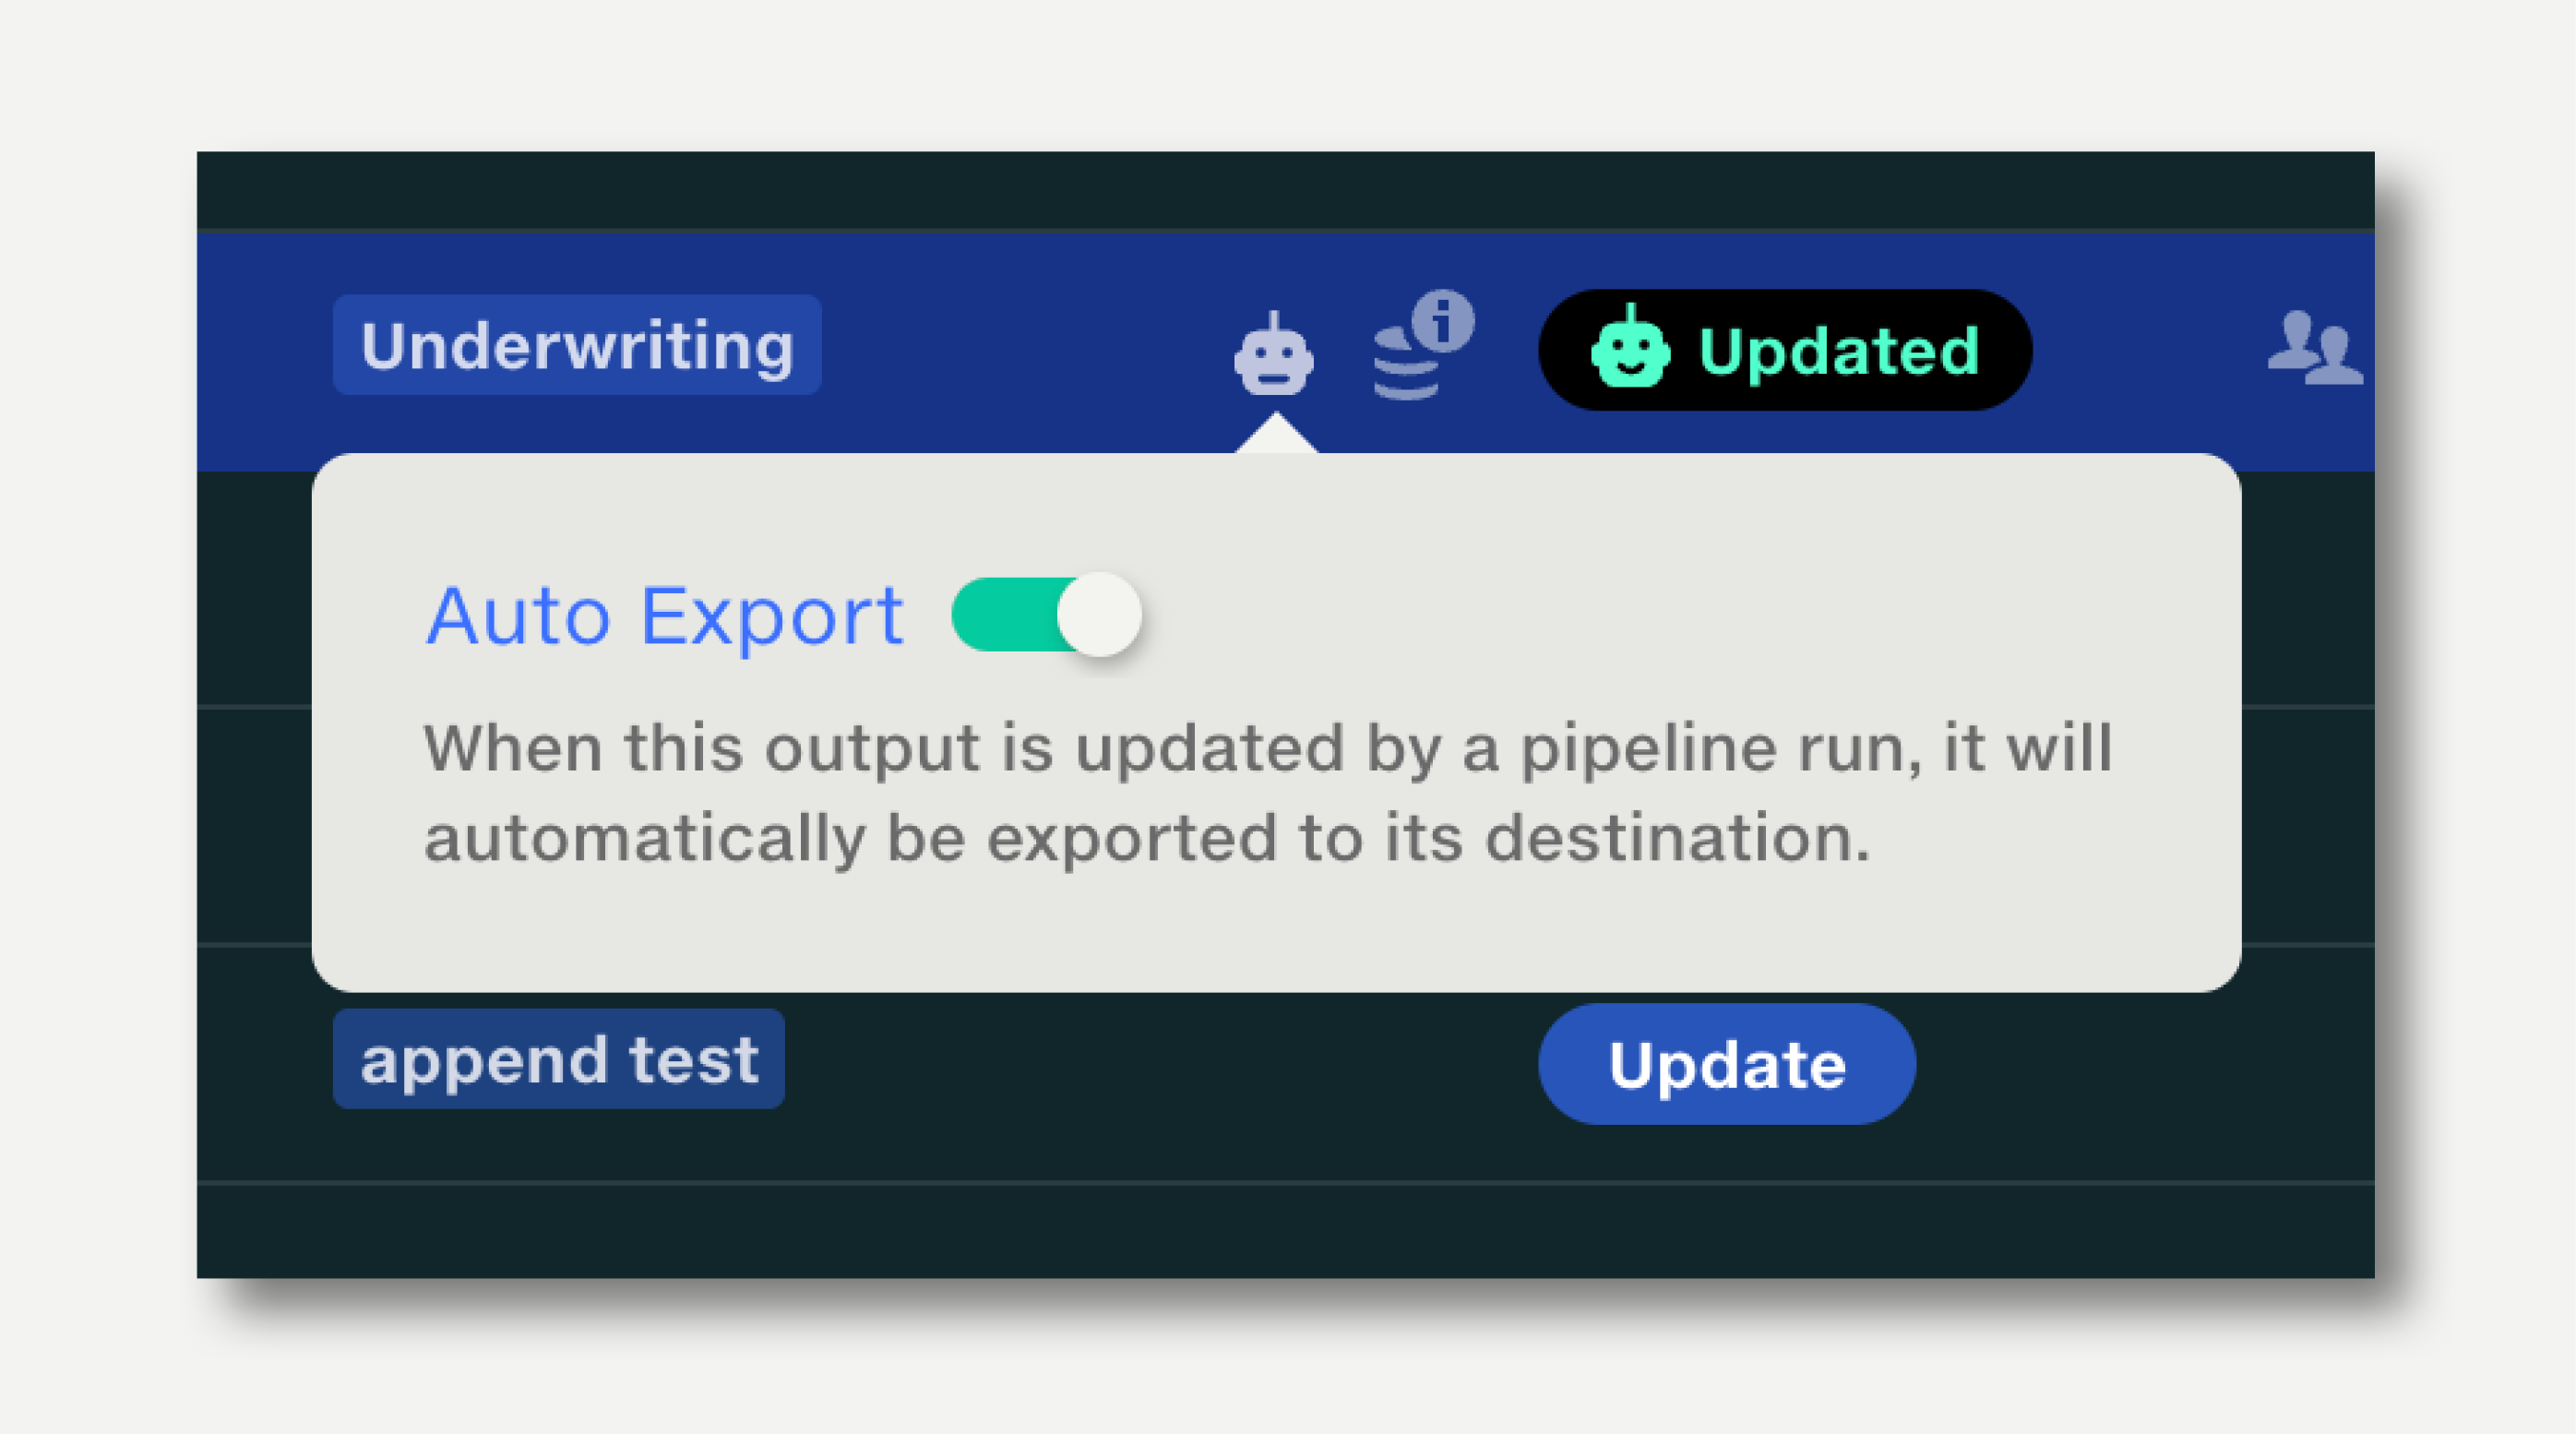
When a pipeline run completes, Auto Export can be set up to automatically send selected outputs to their defined destinations in the Data Repo.
Auto Export will block the export if any validation rules trigger a fail. If only warnings are triggered, Auto Export will occur.
To set up Auto Export:

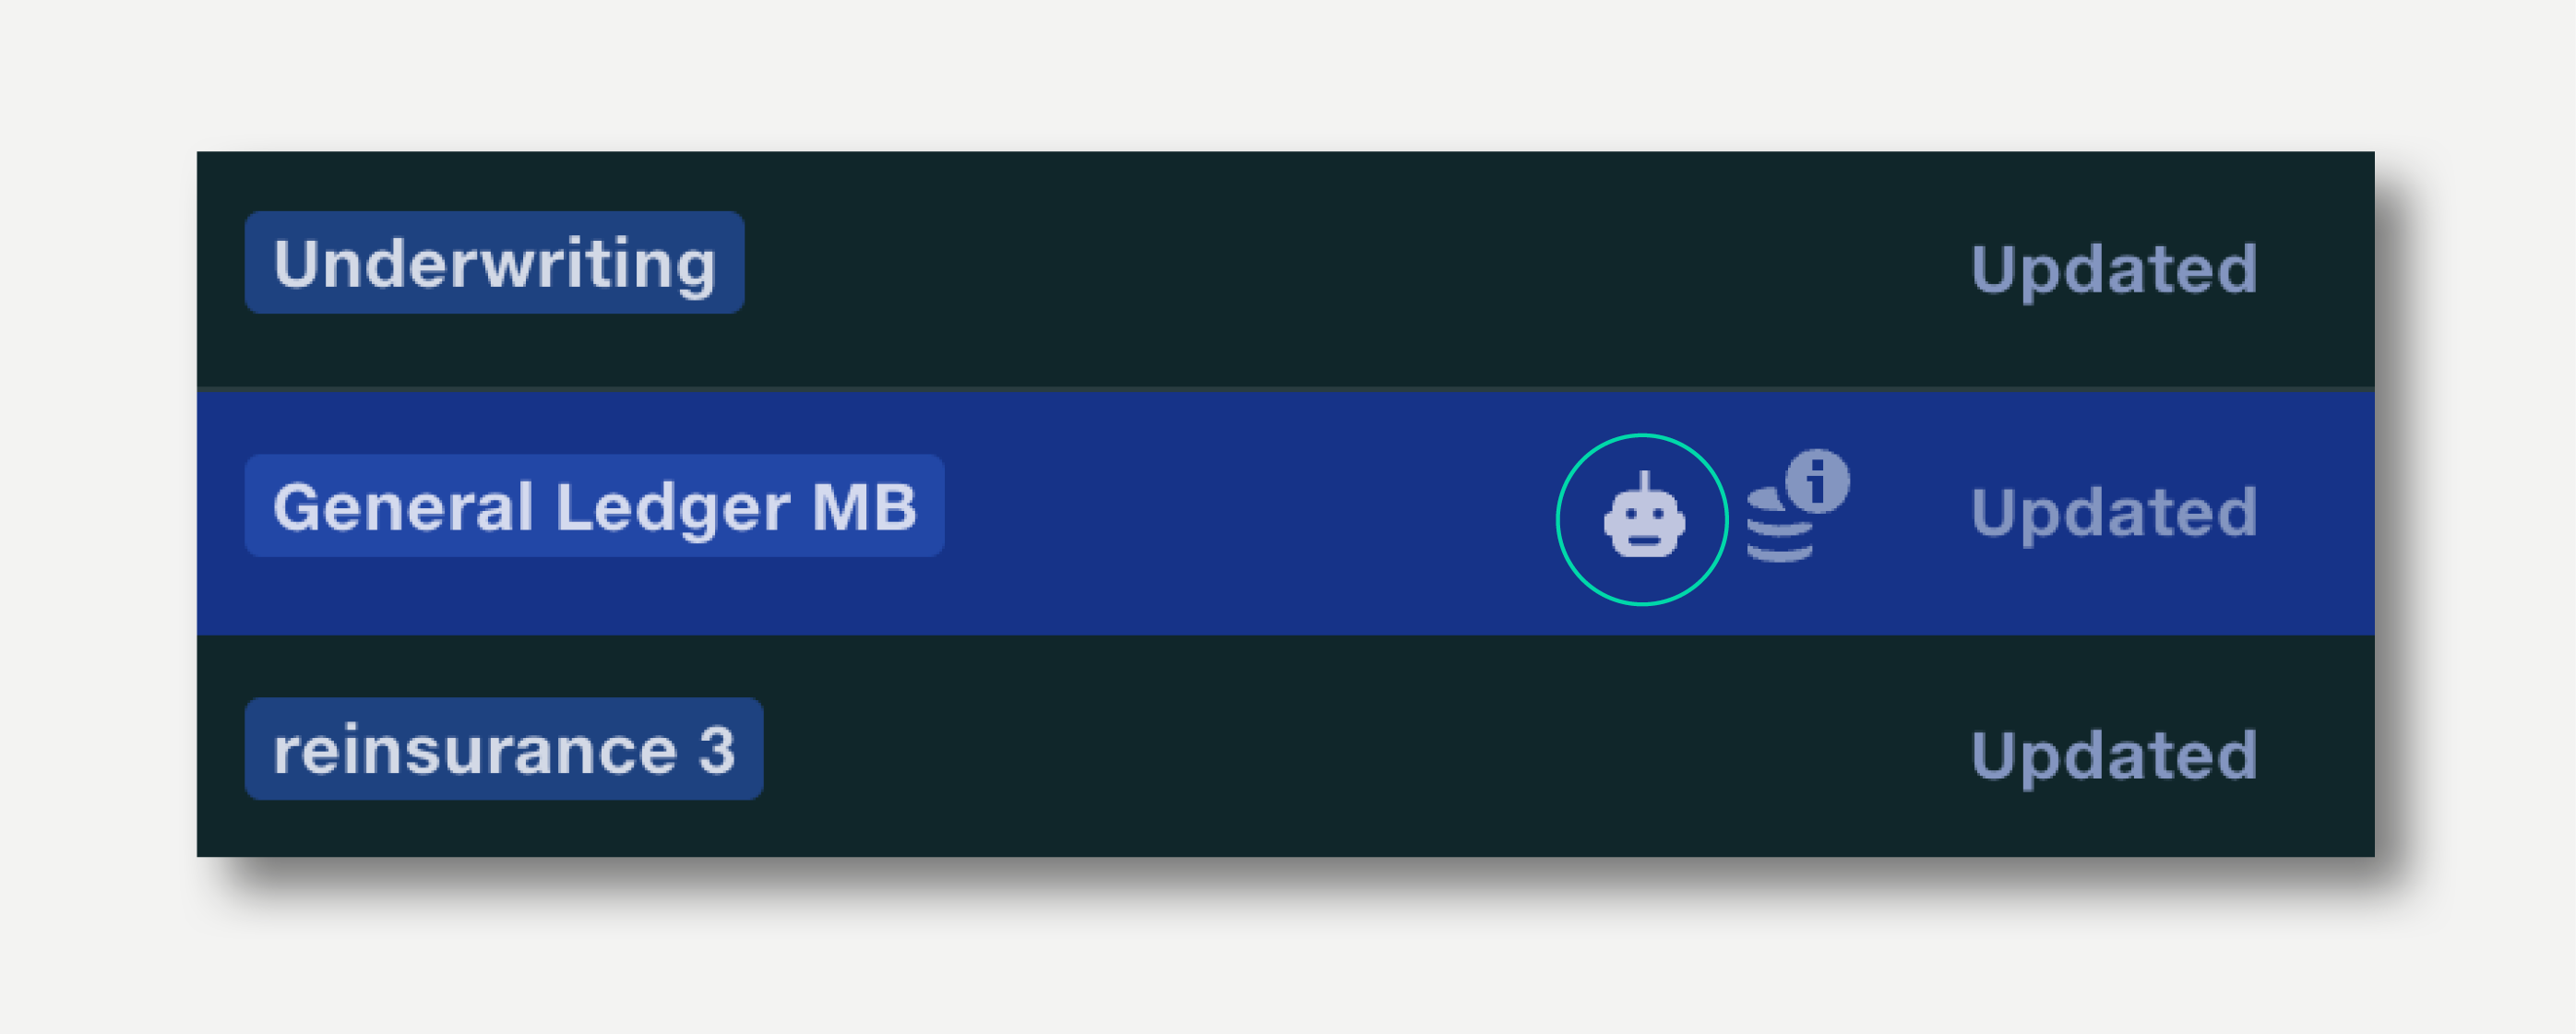
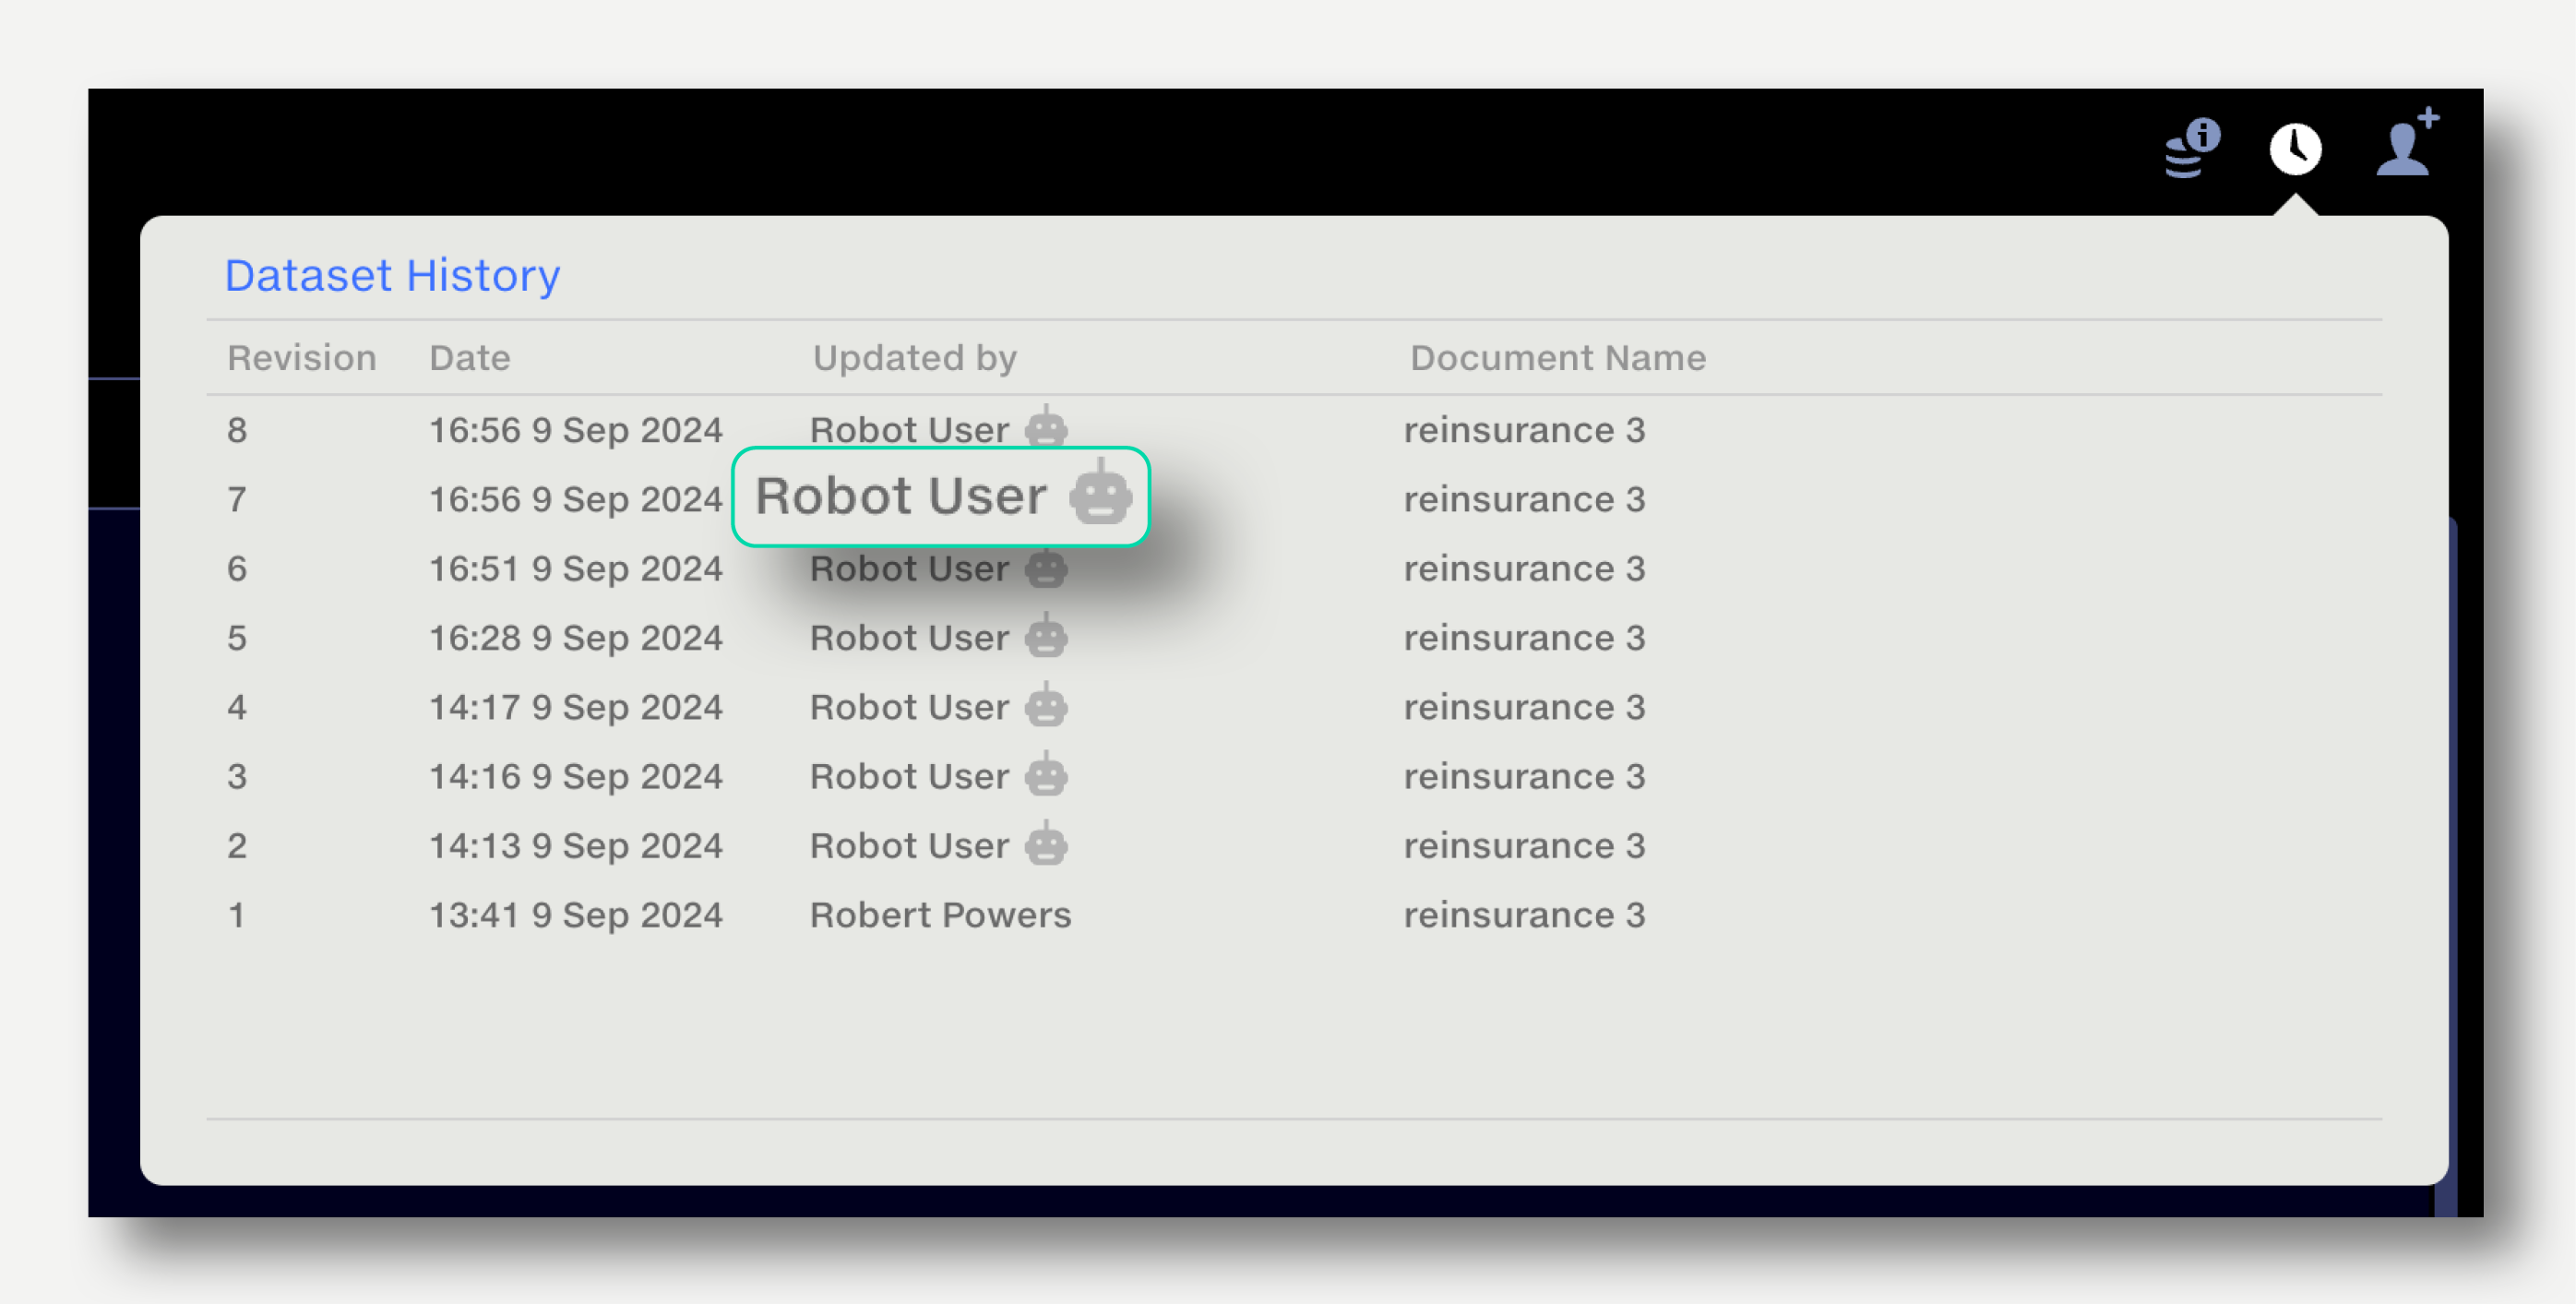
The dataset history will show the Robot User as the last editor.
Auto Export statuses are shown in the Output Datasets section of the Outputs tab.

Auto Export outputs can have the following statuses: