
The validation report provides a summary of the outcome of your validation rules, enabling an assessment of your data quality.
From the summary view you are able to drill down into individual failures to review the failing rows.
After running a pipeline containing validation rules, you can open the validation report by clicking a validation result in the Outputs Summary.
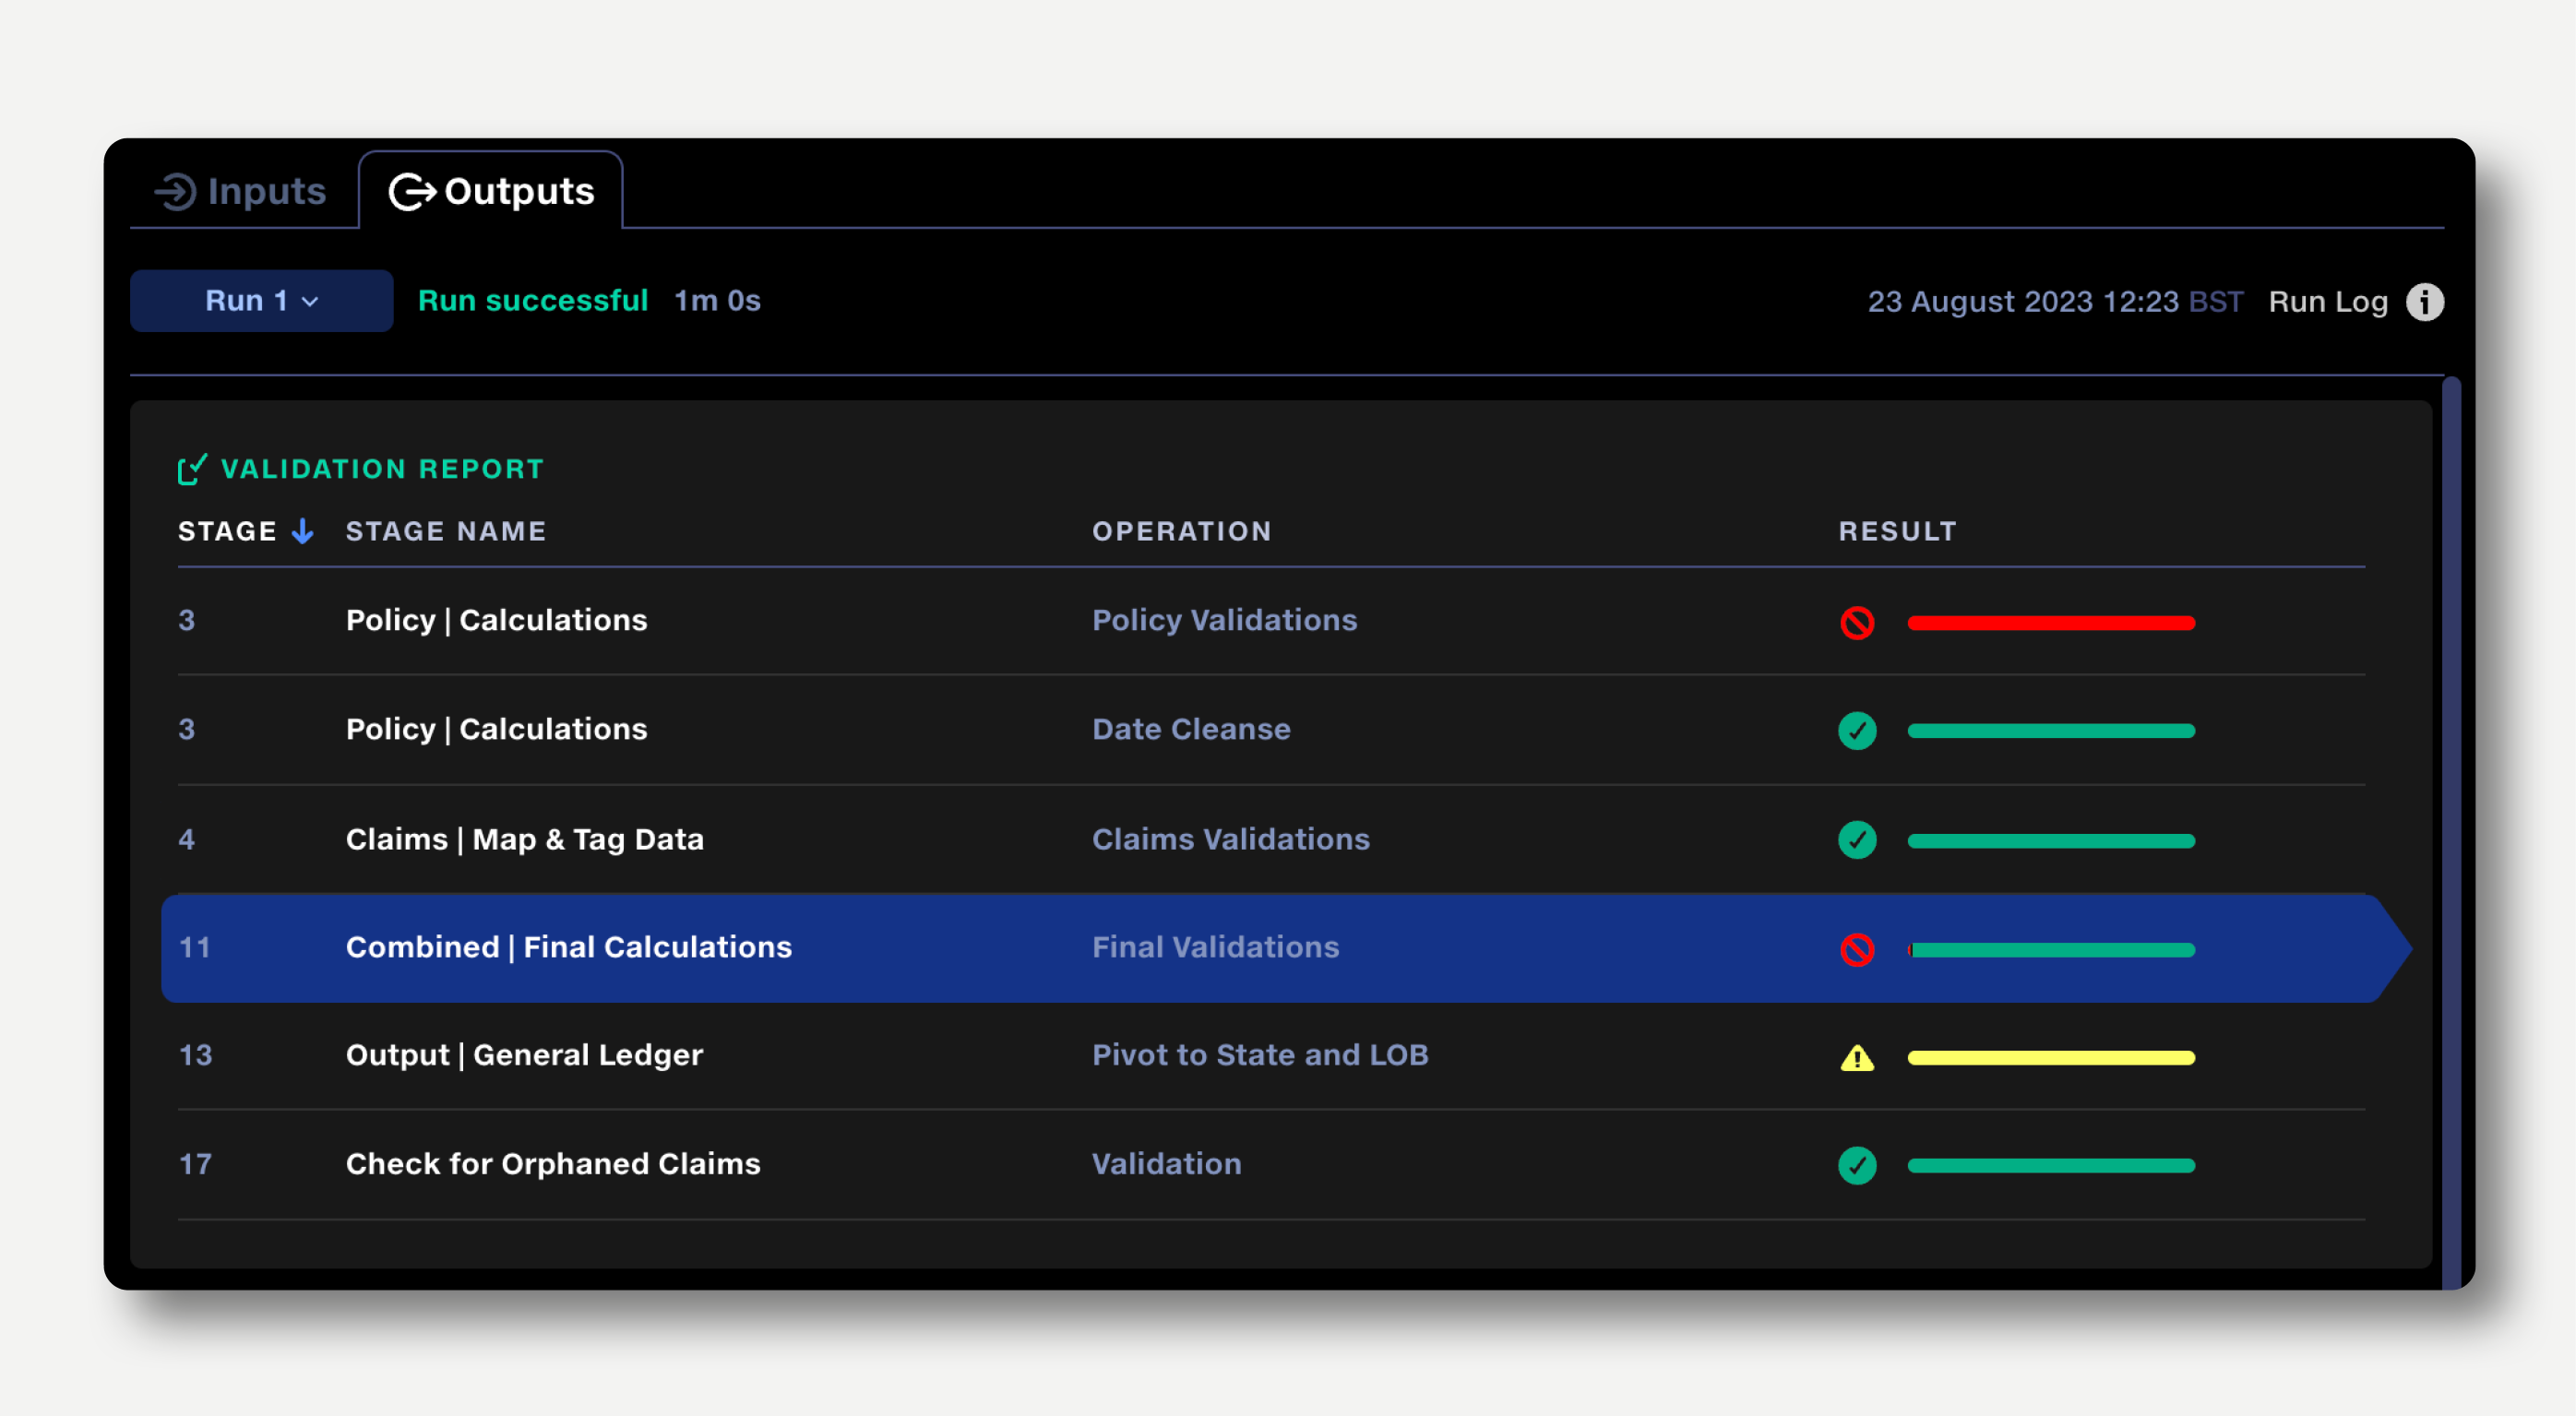
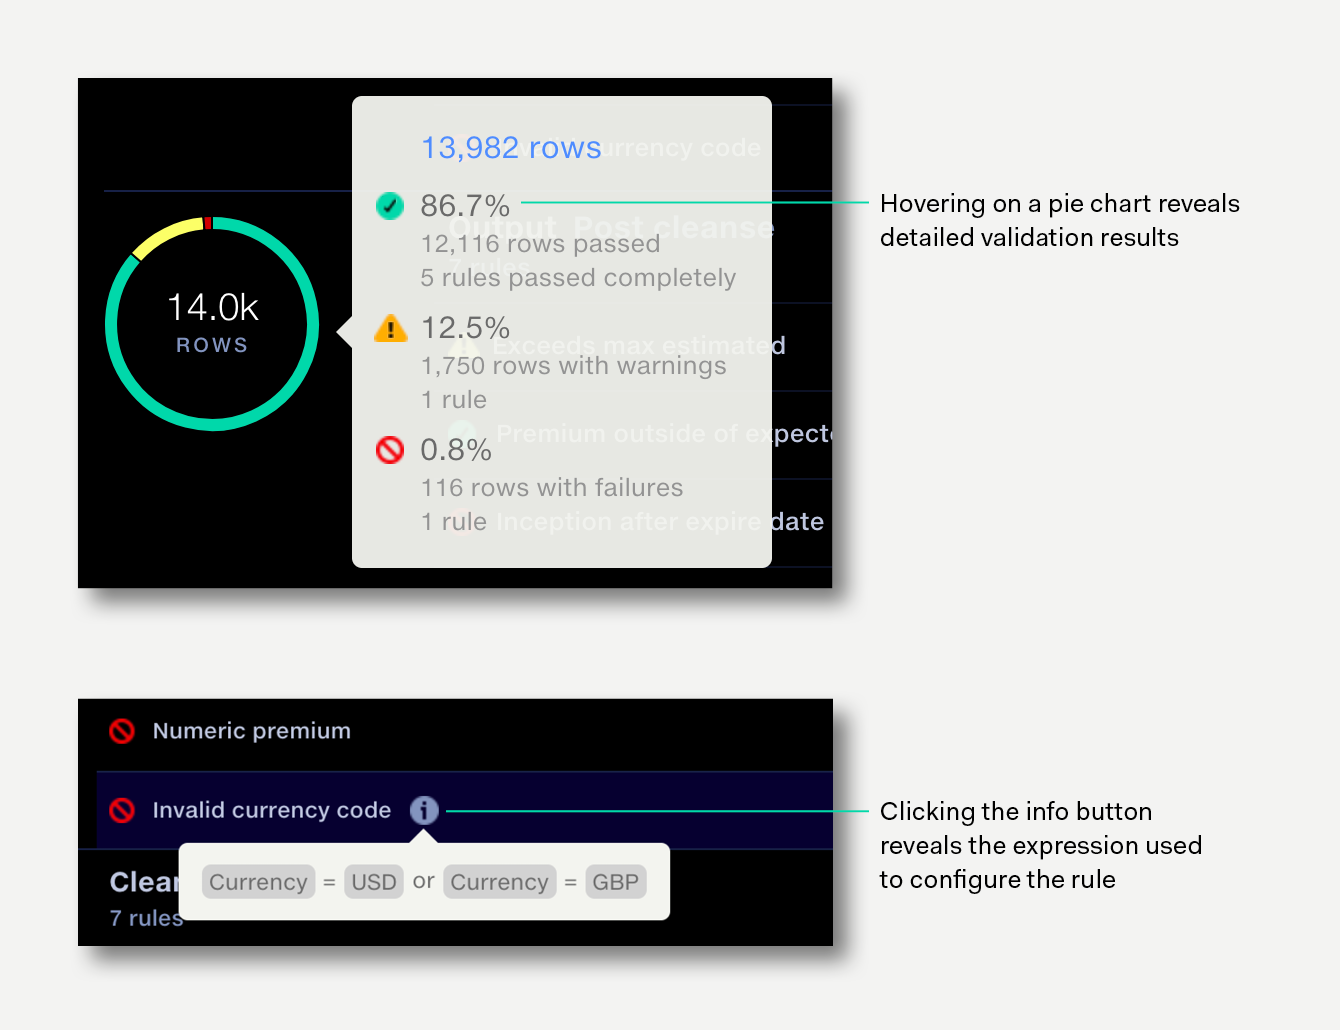
The validation report shows a summary of the results of each validation rule in the pipeline, along with the aggregate results of each validation operation. Clicking the info icon next to the rule description allows you to see the expression used to configure the rule.

Clicking on a rule, drills down to show the distribution of failures across the input files checked. Use the search field on the top right to quickly locate an input file by name.

The bar chart on the left shows the number of failed rows for each input file that has been checked by this validation operation. The bar chart is a useful measure of which input files are contributing the largest number of failed rows to your pipeline.
On the right is a pie chart of the percentage of failed rows within each input file. This is useful to gauge the overall quality of an input file – for instance, a small input file might not be contributing many failed rows to your output data, but could have a high percentage of failures, indicating poor data quality in that particular source.

From the failures by inputs view, clicking on an input will show you the rows of data within that single input file that have failed the rule.
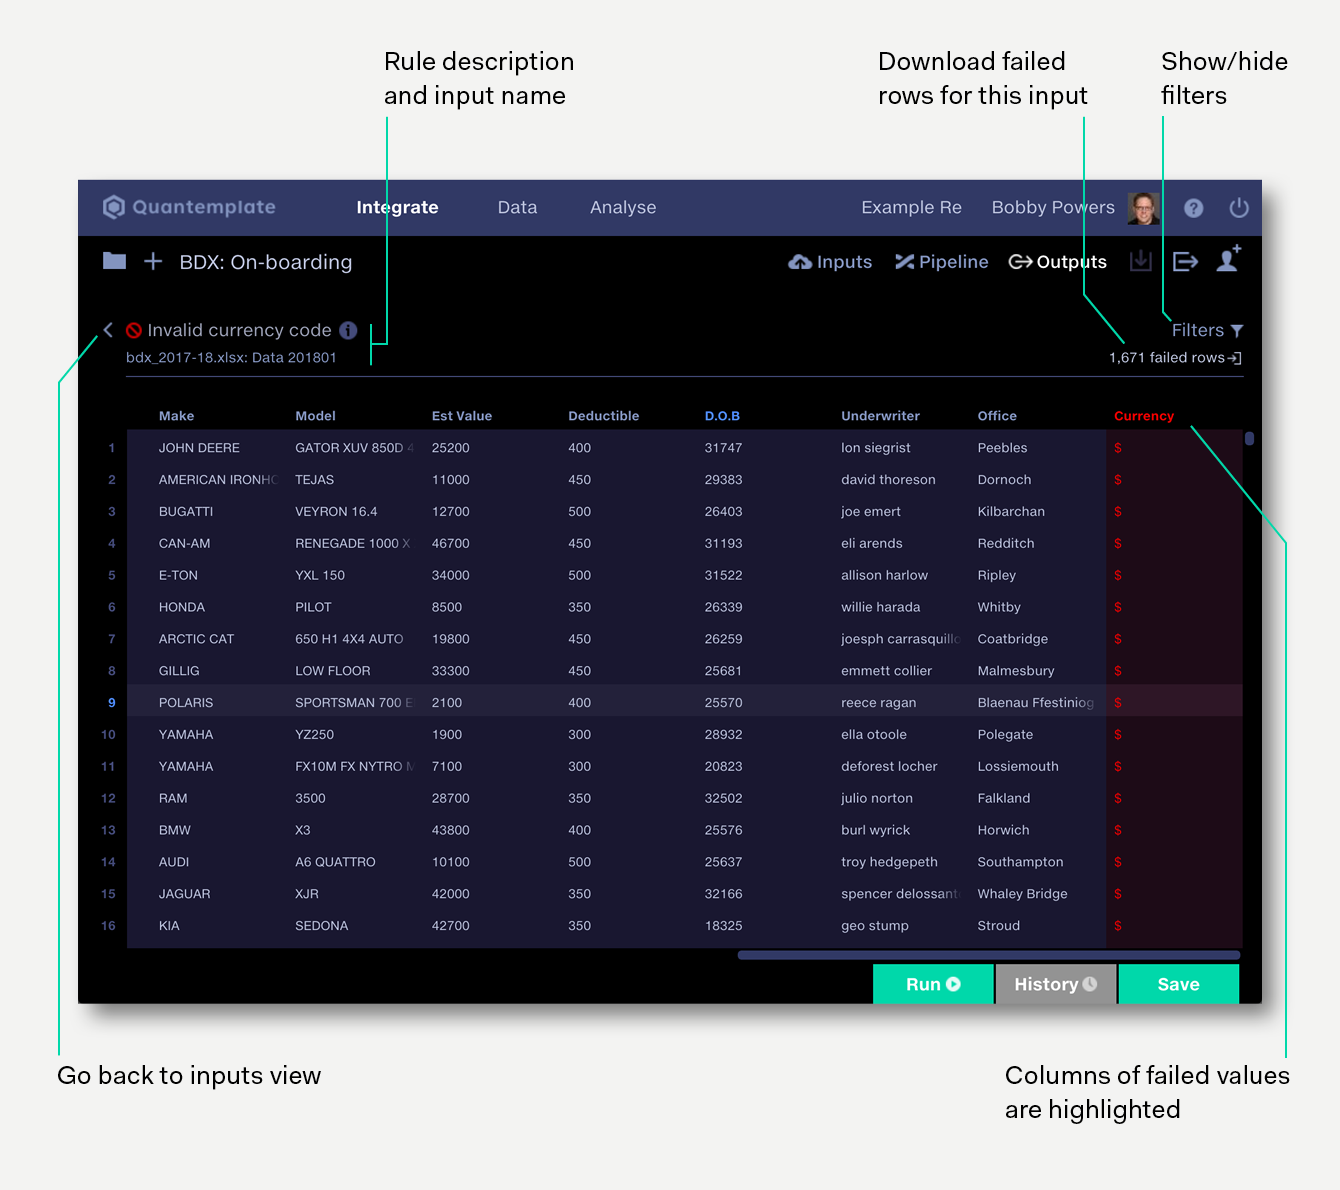
The columns referenced in the validation rule are highlighted – these are the values which have failed the validation check.
When you place the cursor over the table of data, the row and column names are highlighted. This makes it easier to find the column name and row number of a data value.
To get back to the previous view, click the rule name or the back arrow at the top left.
Clicking the ‘Filters’ button shows the filter panel, allowing you to filter the data to better understand the rows that have failed the rule. Clicking ‘Filters’ button again will hide the panel, but filters remain applied.
The colour of the filters button indicates whether filters are applied.

Filters can be added, disabled or removed.

Rows from each input which have failed the validation rule can be exported to your Data repo in Quantemplate or downloaded to your computer. To export the failed rows, hover over an input and the Download/Export button will appear.
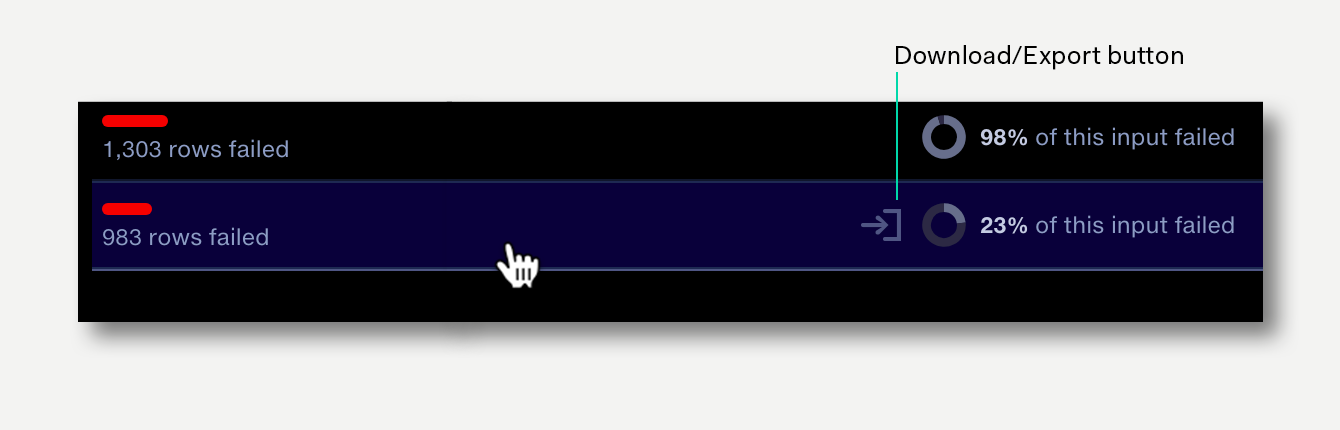
Clicking the download button will open a popup with buttons to download or export the failed rows. To export the failed rows to your Data repo, enter a name for the new dataset in the field.
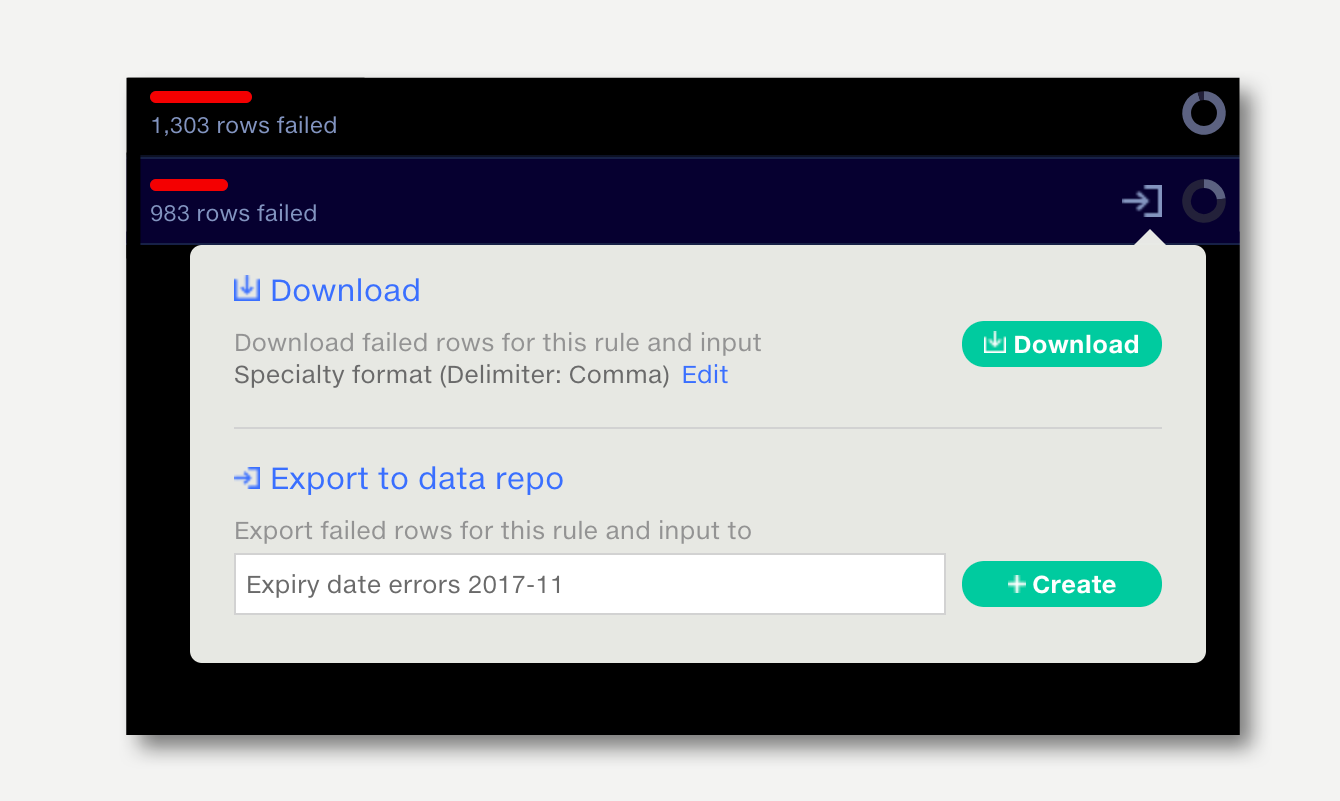
Alternatively, overwrite an existing dataset by selecting one from the list of suggestions. The button changes from ‘Create’ to ‘Update’.
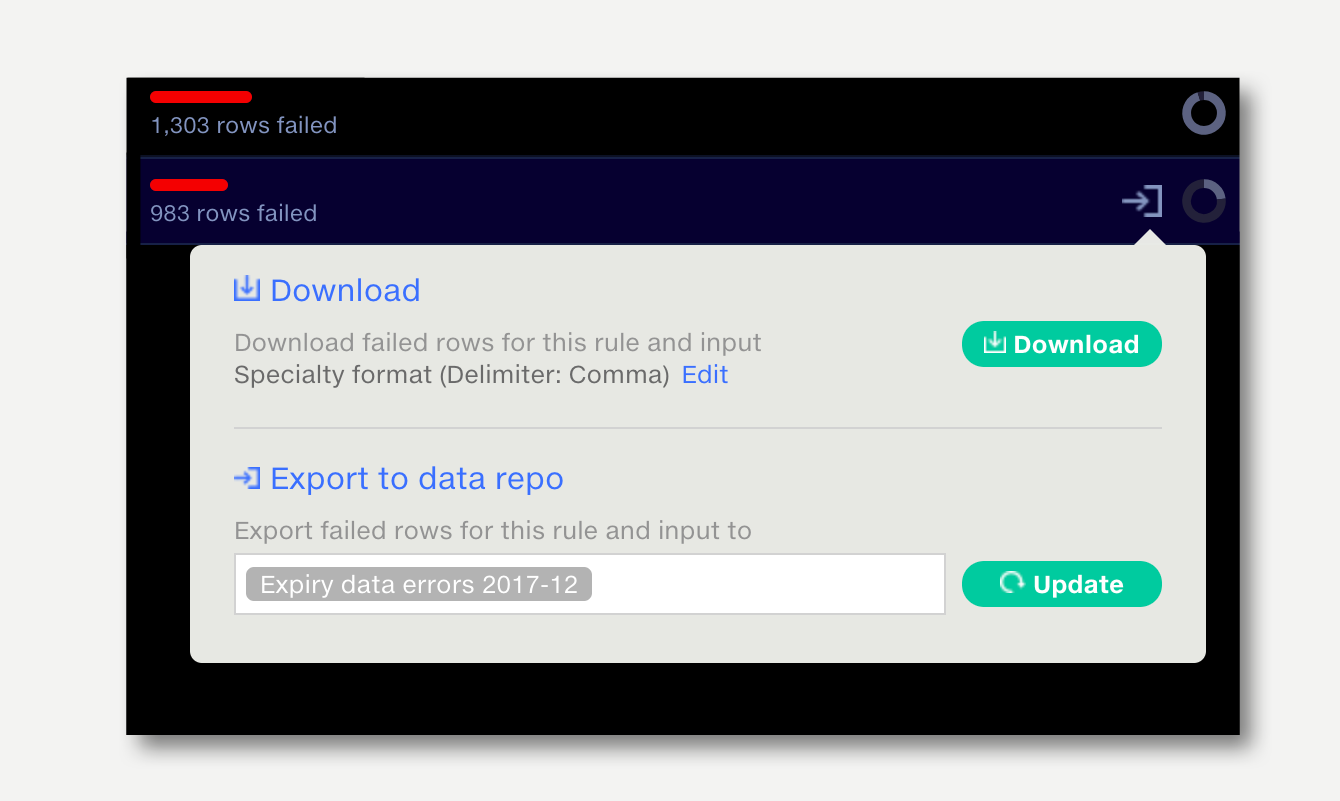
To download the failed rows to your computer, click the download button. To change the file format of the downloaded data, click ‘Edit’.
This shows the download format options.
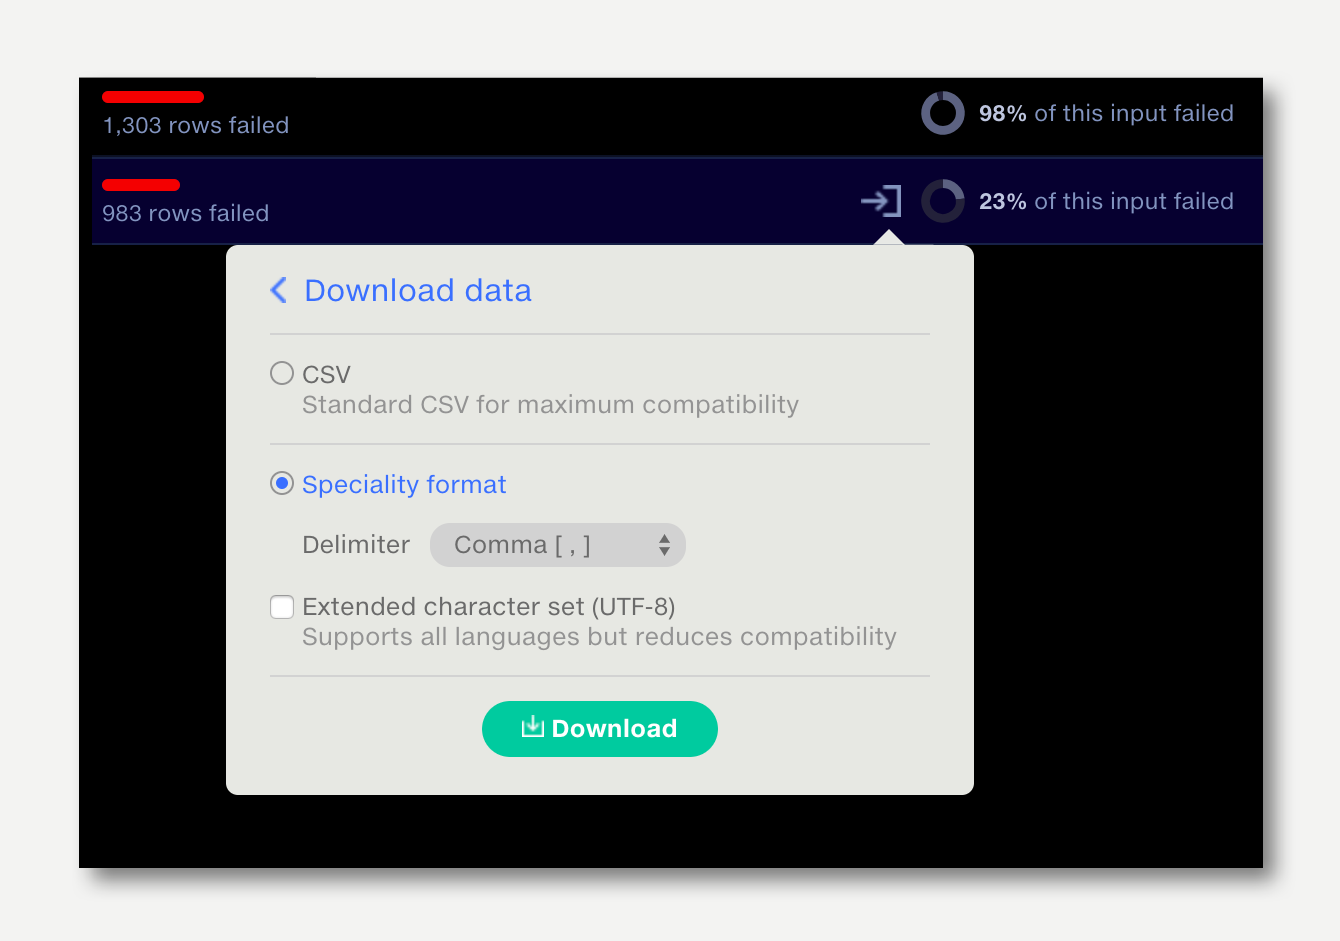
Select the format you require, then click ‘Download’.
Alternatively, when viewing the failed rows themselves, click the download button on the top right.

For more information on download formats, see Download file formats.