The Aggregate operation enables the merging of rows of source data into a new table comprising:
Rows are merged together when they share the same values across all Dimension columns, similar to categories in a pivot table.
When rows are merged, the values in Aggregation columns are combined using an aggregation method (sum, count, mean, etc).
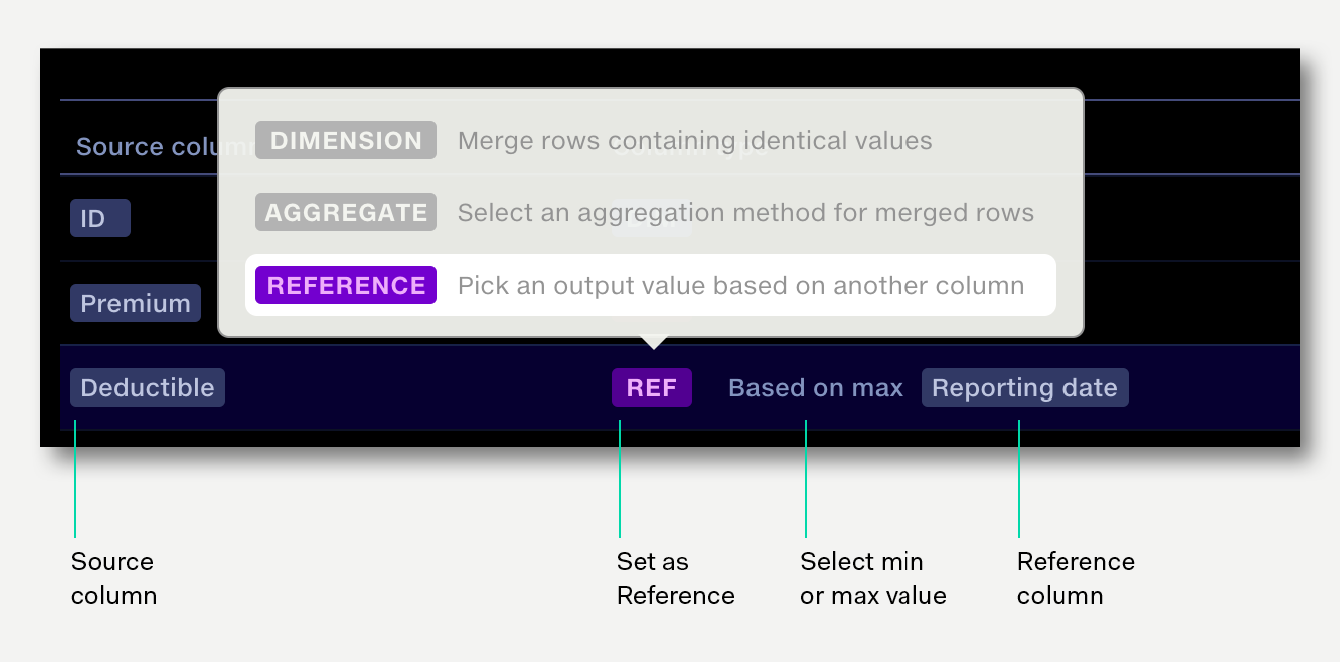
When rows are merged, columns set as a Reference aggregation take a value based on the value of another column. For example, pick the most recent value by referring to a column of dates.
Uses for the Aggregate operation include rolling-up transactional data to point-in-time data by reporting period, or to calculate totals and count across a data set.
For source data where the column types are set as follows:
|
DIM
|
AGG Max
|
REF*
|
AGG Sum
|
|
Policy ID
|
Reporting Date
|
Deductible
|
Premium
|
|
P92340
|
20170101
|
45
|
100
|
|
P92340
|
20170201
|
30
|
200
|
|
P92341
|
20170101
|
35
|
150
|
|
P92341
|
20170201
|
45
|
250
|
* REF set to pick deductible with max reporting date
The aggregated output data will be:
|
Policy ID
|
Reporting Date
|
Deductible
|
Premium
|
|
P92340
|
20170201
|
30
|
300
|
|
P92341
|
20170201
|
45
|
400
|
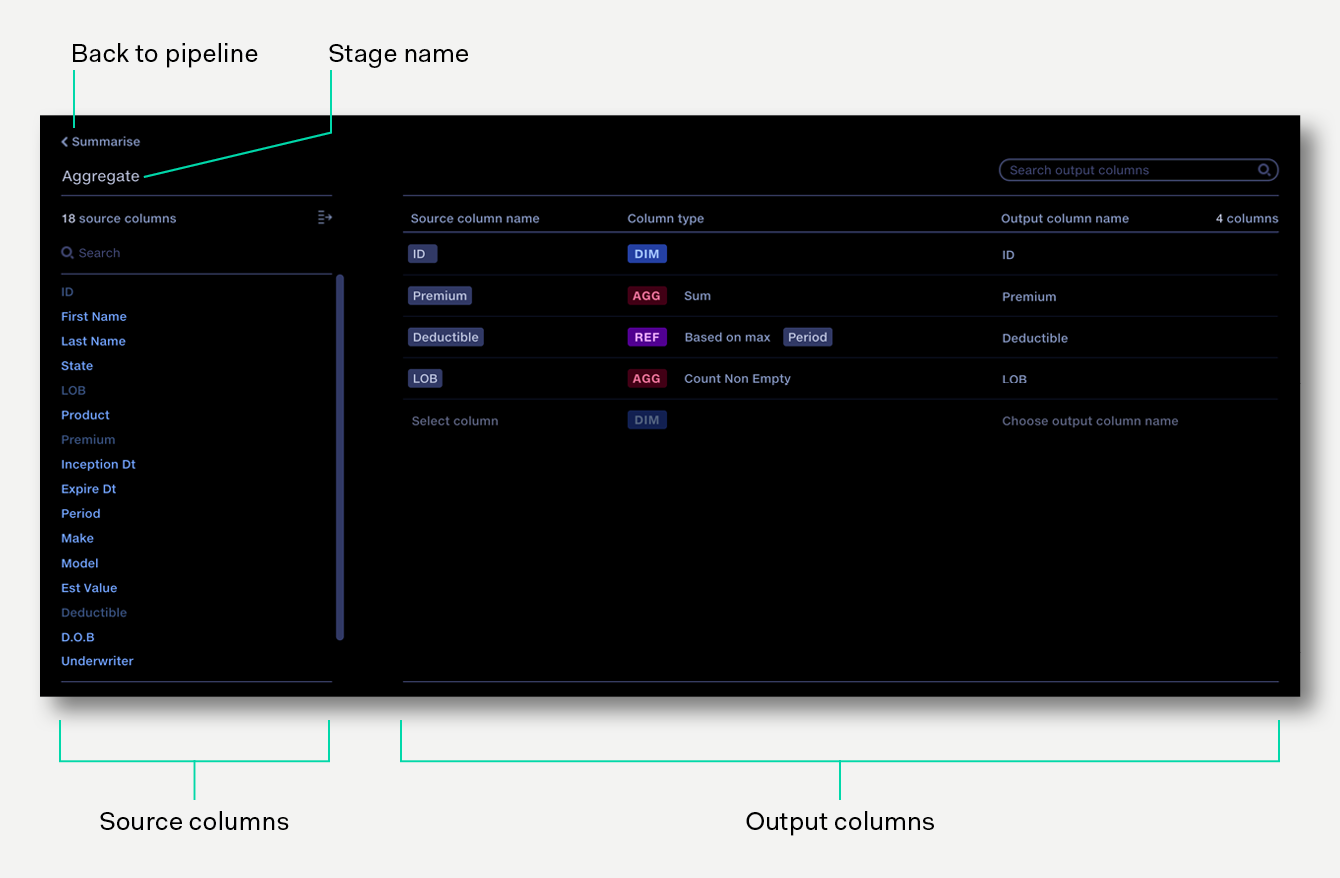
Click to edit the operation name
List of all columns in all input files to the operation. Click on a source column to add it to your output dataset.
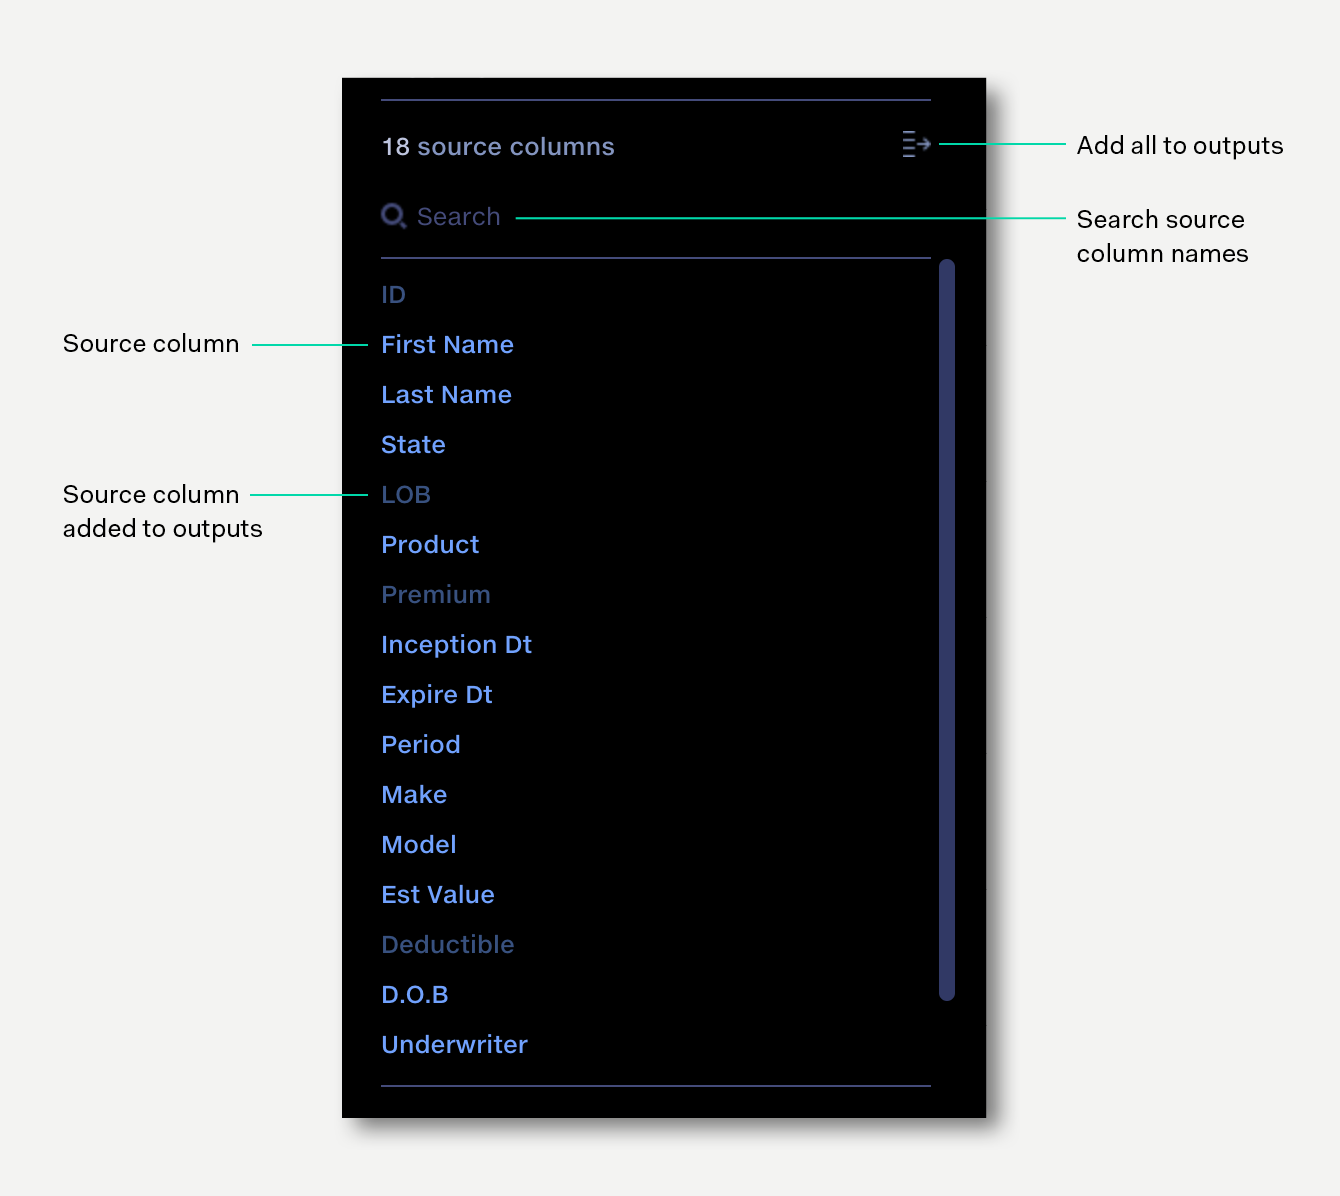
Columns appear in the the order found in the input files. Search can be used to locate a particular column. Once added to the output dataset, columns are shown faded-out in the Source panel.
List of columns which will be created in the output dataset.
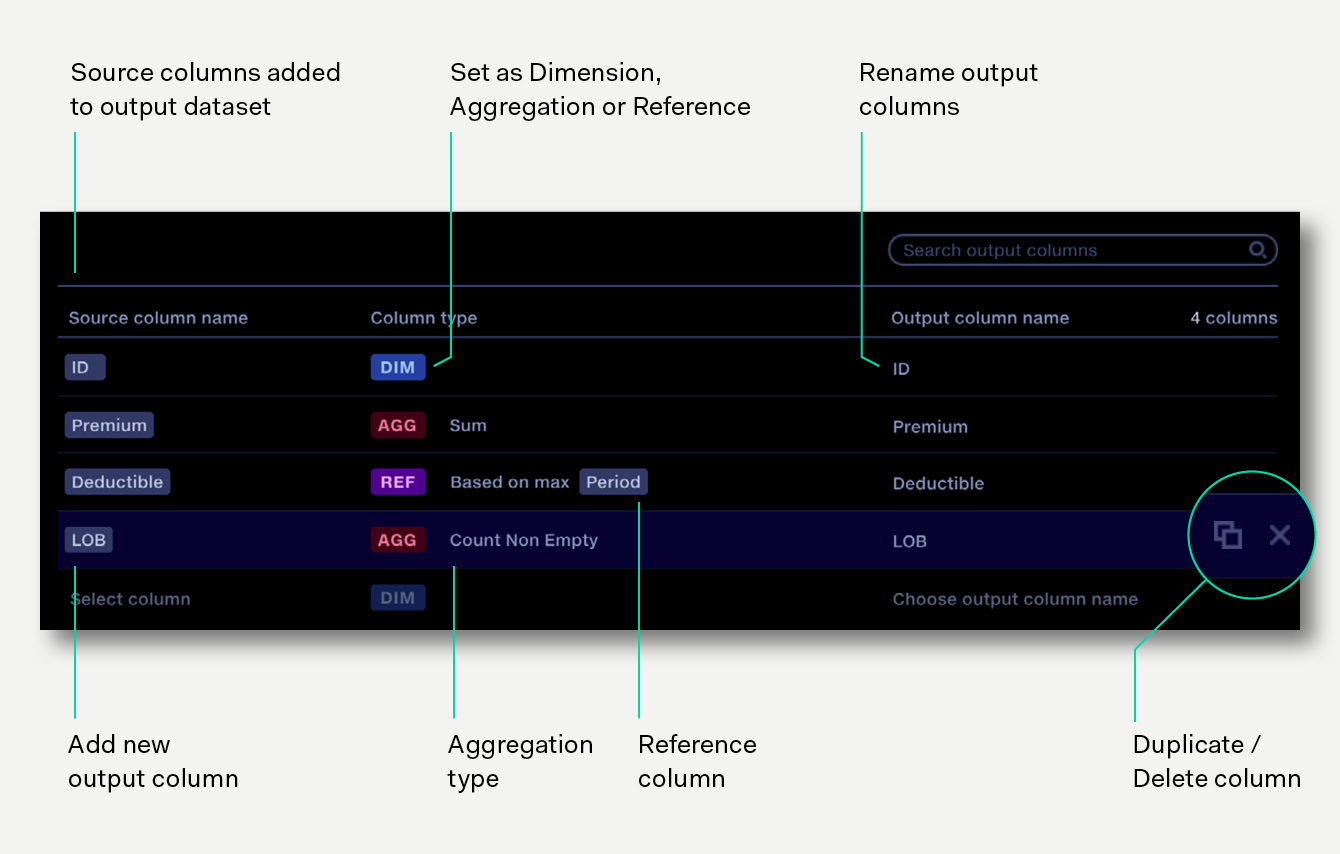
Columns can be configured as Dimensions, Aggregations or References. The order of items in the output columns panel (top to bottom) indicates the order of columns in the output dataset (left to right). Output columns can be can be reordered or renamed, duplicated and deleted
To configure the aggregate operation:
Click on a source column to add it to the output dataset. To add multiple columns, click the 'Add all' button to add all columns visible in the source list to the outputs at once. If the list has been filtered by search, clicking 'Add all' will add only the search results to the outputs.
Alternatively, click ‘Select column’ at the bottom of the output columns list then select a source column from the drop down list.
As each input column is added to the output table, it is configured by default as a Dimension. Click on the column type to set it to an Aggregation, then select the aggregation type, or set it as a Reference aggregation if required.
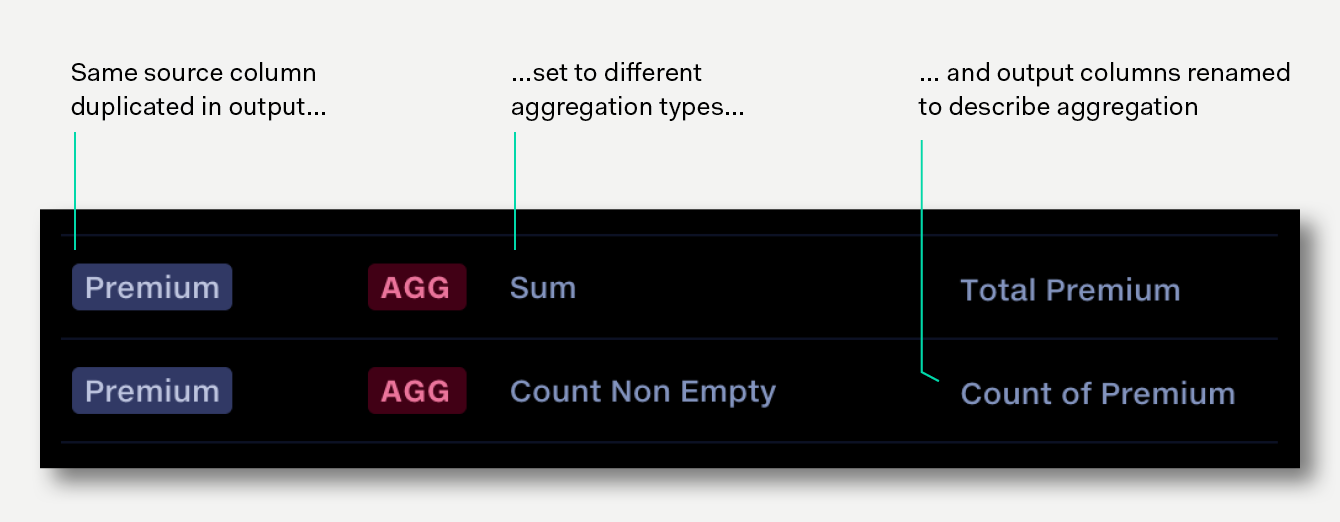
By default, output column names take the same name as an input column. Click on the output column name to edit it. This can be useful for aggregated columns, e.g. rename Premium to Total Premium.
To duplicate an output column, click the duplicate button at the end of the row.
The order of the output columns can be changed by dragging the output column to the desired position.
Where a column should be aggregated across merged rows, the column type should be change to AGG and an aggregation type chosen.
Max |
Largest value |
Min |
Smallest value |
Sum |
Total of all values |
Mean |
Average value |
StdDev |
Standard deviation of values |
Count Numeric |
Number of numeric values |
Count Non Empty |
Number of values, excluding empty values: "" |
Count Distinct |
Number of distinct values |
When aggregating rows it’s fairly common to find that some columns are neither Dimensions nor straight forward Aggregations. This can often be the case with categories that change, but the change is not significant enough to warrant a separate row – instead you just want to pick one of the values. For example, picking the most recent value based on another column of dates.
Reference aggregations help with this. When a source column is set to Reference, one of the values in that column is selected by looking at the value in another reference column (e.g. date) then choosing the source value from the row with either the minimum or maximum value in the reference column (e.g. earliest / latest date)
|
Policy ID
|
Reporting Date
|
Deductible
|
Premium
|
|
P92340
|
20170101
|
45
|
100
|
|
P92340
|
20170102
|
30
|
100
|
|
P92340
|
20170103
|
35
|
100
|
In this case you may determine that for point-in-time data you want the most recent deductible. For this, using a standard aggregation (Sum, Mean, Max) doesn’t give the value required. The reference option allows the selection of the deductible value based on the Reporting Date.
|
Policy ID
|
Deductible
|
Premium
|
|
P92340
|
35
|
300
|
Any non-numeric values in the reference column will be ignored. Where there are multiple rows with the same reference value the lowest value of the source column will be chosen by natural sort (numeric sort, then text ordering).
In some scenarios you will want all available source columns to flow through an Aggregate operation and be included as output columns. As new inputs are added and changed over time, new source columns may flow into the stage, but without a corresponding entry in the Aggregate output panel they will be ignored.
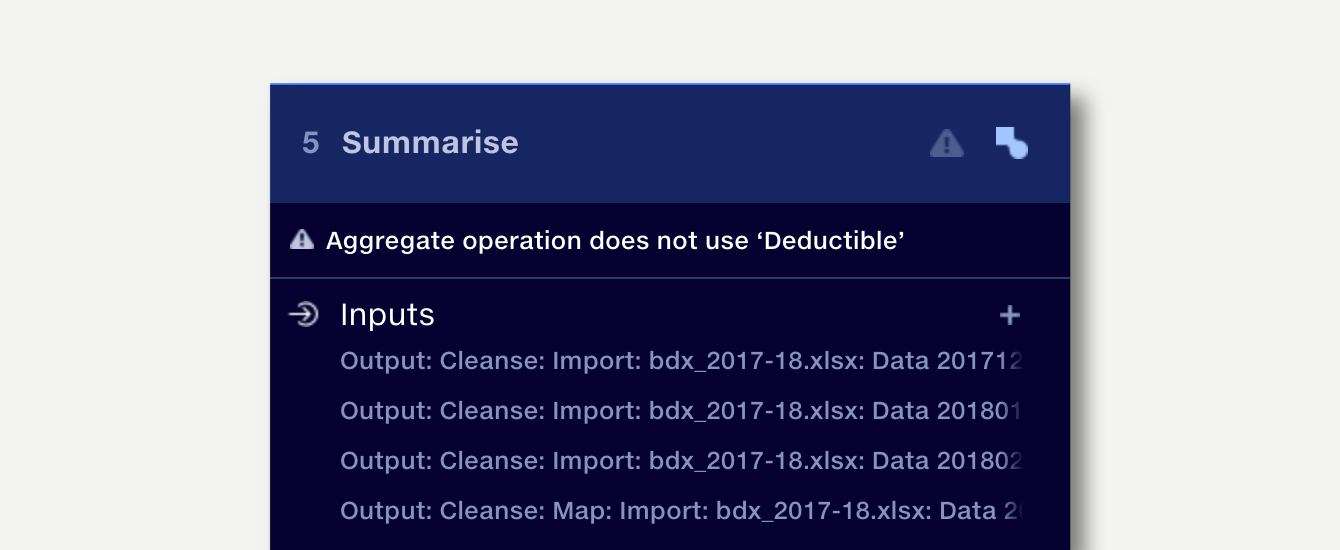
The Aggregate operation can be configured to generate a warning if there are columns in the input data that are not being processed by the operation.
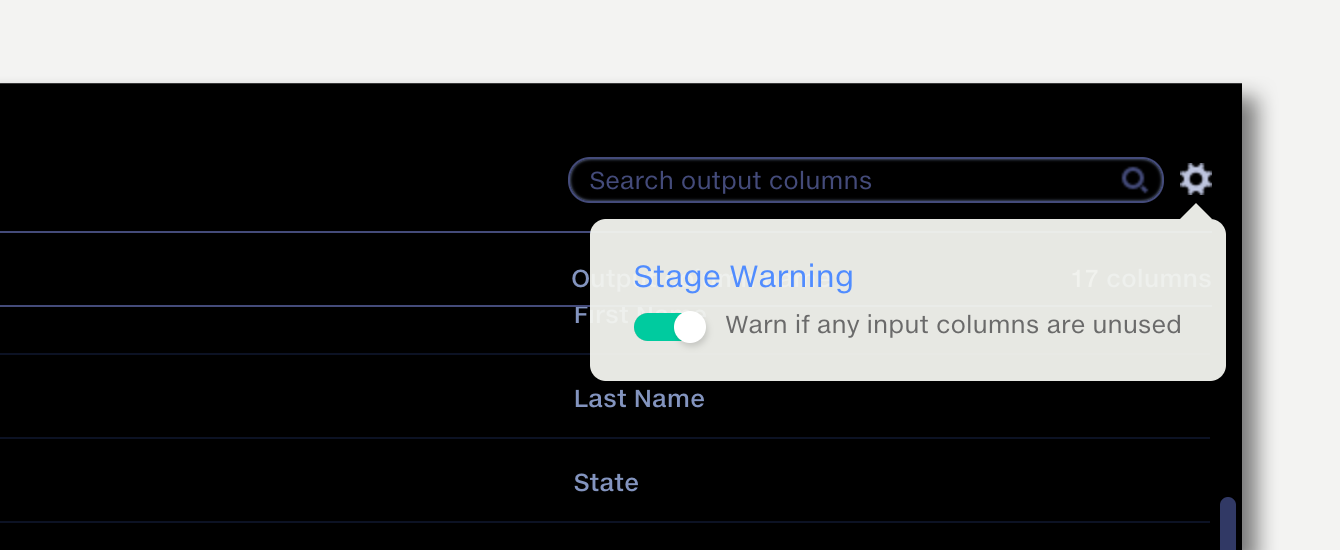
The warning is displayed in the stage panel of pipeline editor. For example, if a new column called “Deductible” is added to an operation input and the operation configuration is not updated to include it in the output, then the following warning will be shown:
When aggregating large data sets, it can be hard to know whether all rows were aggregated as intended. Quantemplate can validate your configuration, generating a report of merge failures.
For the following source data:
|
ID
|
Period
|
Product
|
Premium
|
|
P92340
|
2017-11
|
MOTOR_STD
|
164.83
|
|
P92340
|
2017-11
|
MOTOR_STD
|
-2.00
|
|
P92340
|
2017-12
|
MOTOR_CLASSIC
|
220.71
|
|
P92341
|
2017-12
|
MOTOR_STD
|
164.83
|
If we want to get the total Premium for each policy in a reporting period, we would expect two output rows, one for 2017-11, one for 2017-12.
If we want the output to retain the Product information we would add it to the Aggregate configuration as a Dimension. However, as the rows for 2017-12 contain different values for Product, this would result in two output rows for 2017-12.
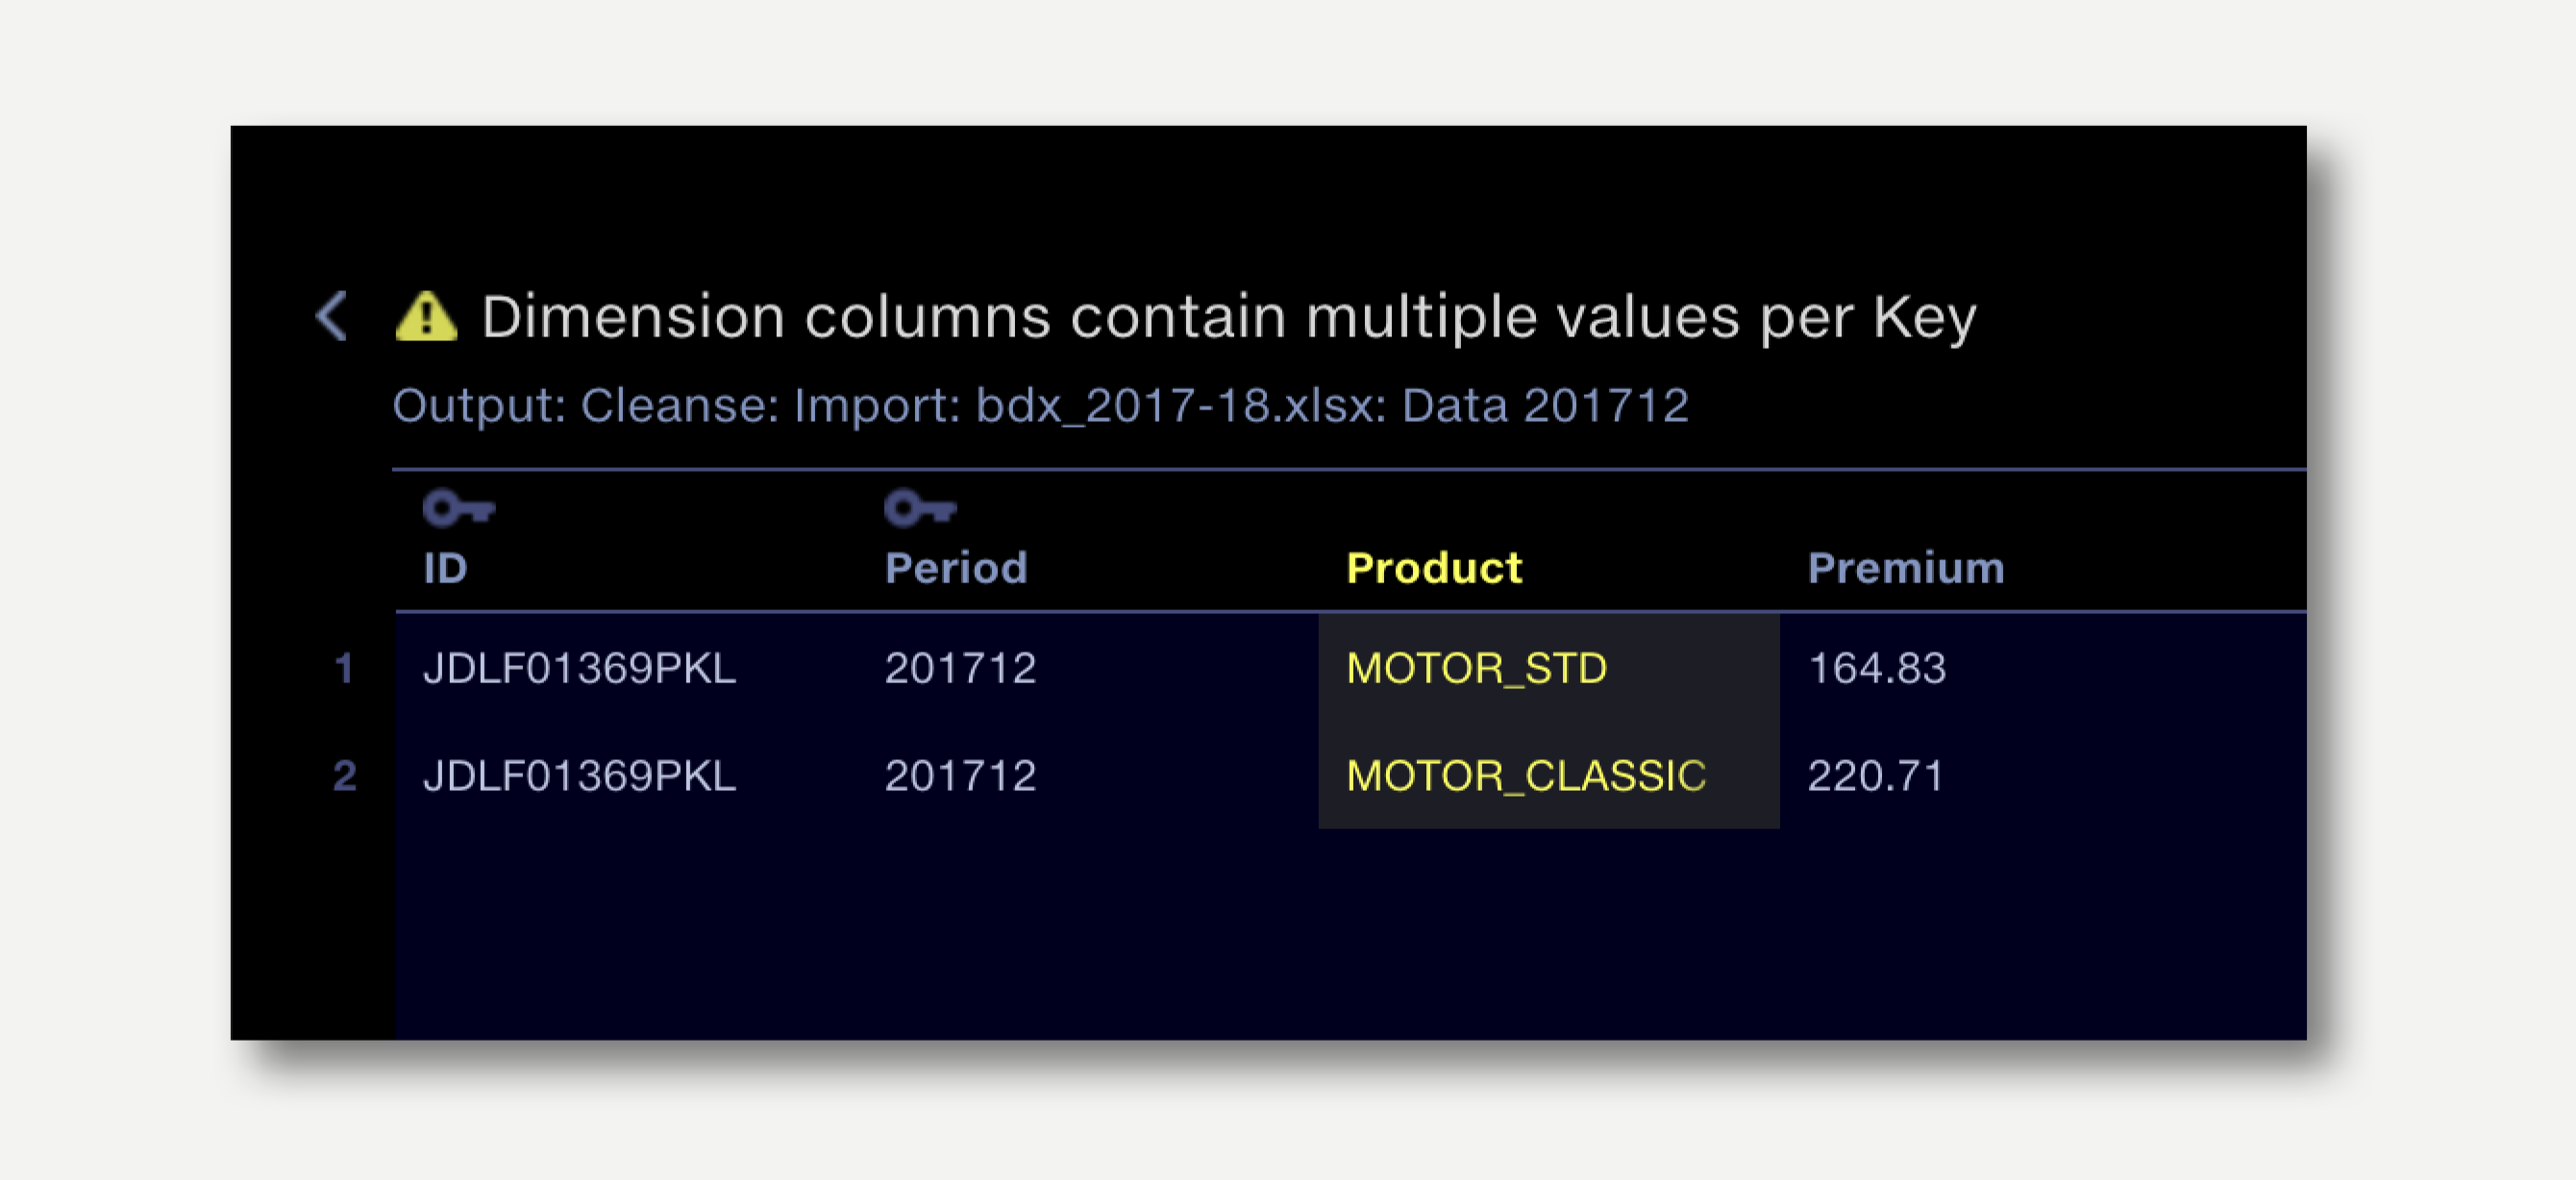
Detecting this type of issue in the data manually can be time consuming, so we use Key Columns to create a validation warning when this occurs.
The Aggregate operations allows us to identify the Key Columns. The set of key columns indicate that:
In the example above we can mark the ID and Period columns as key columns by clicking the key icon in Column Type.
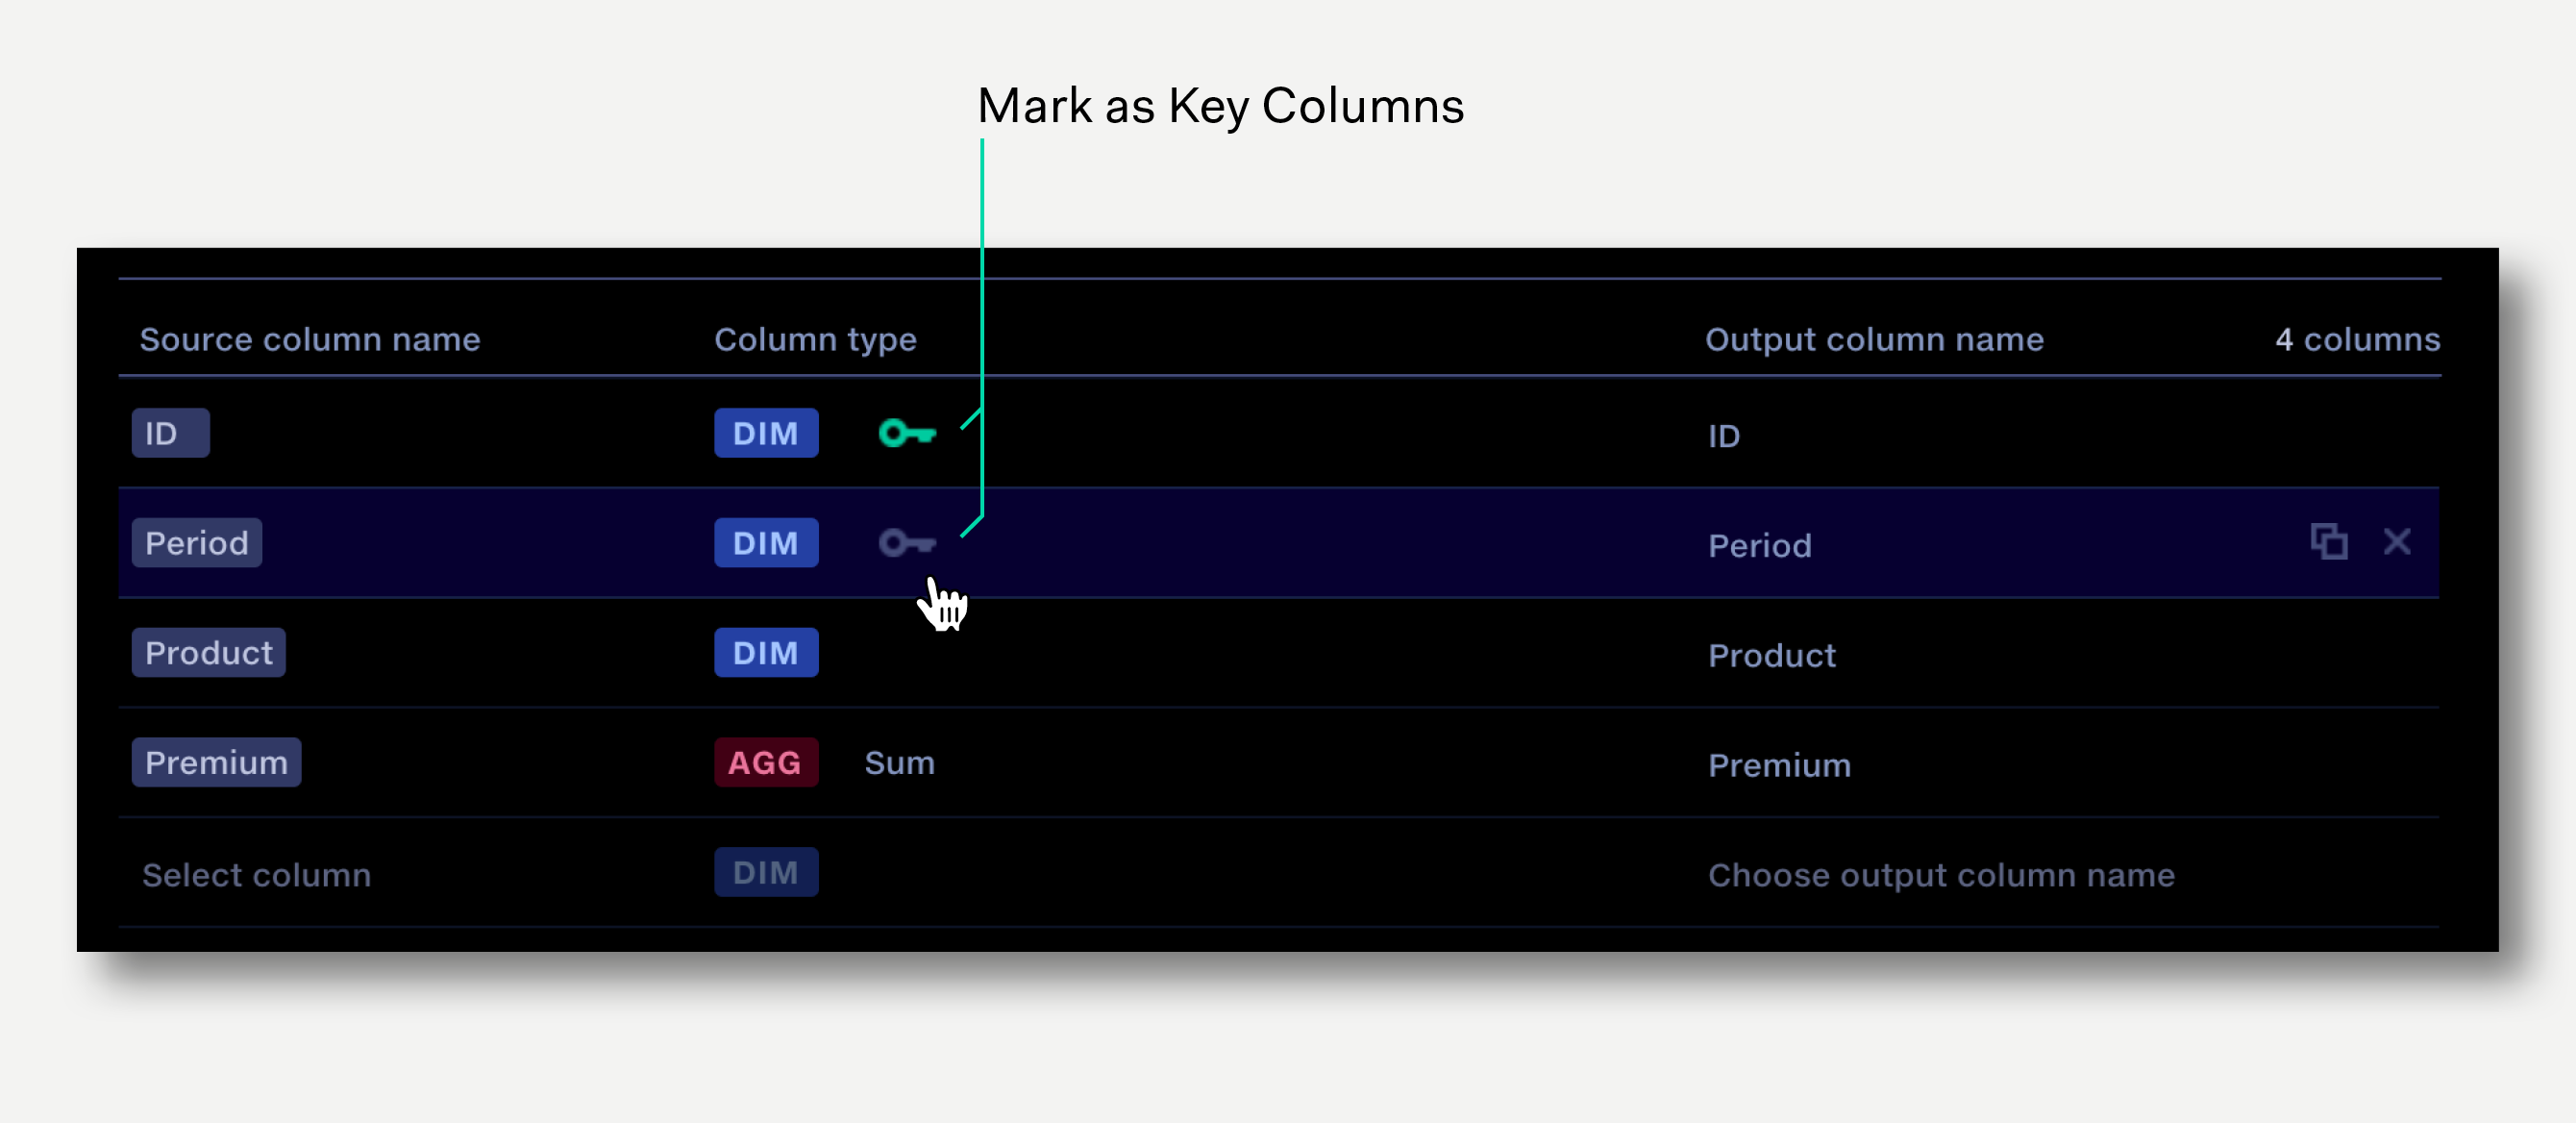
When the pipeline is next run the Validation report will contain an entry for each Aggregation operation where key columns have been identified.
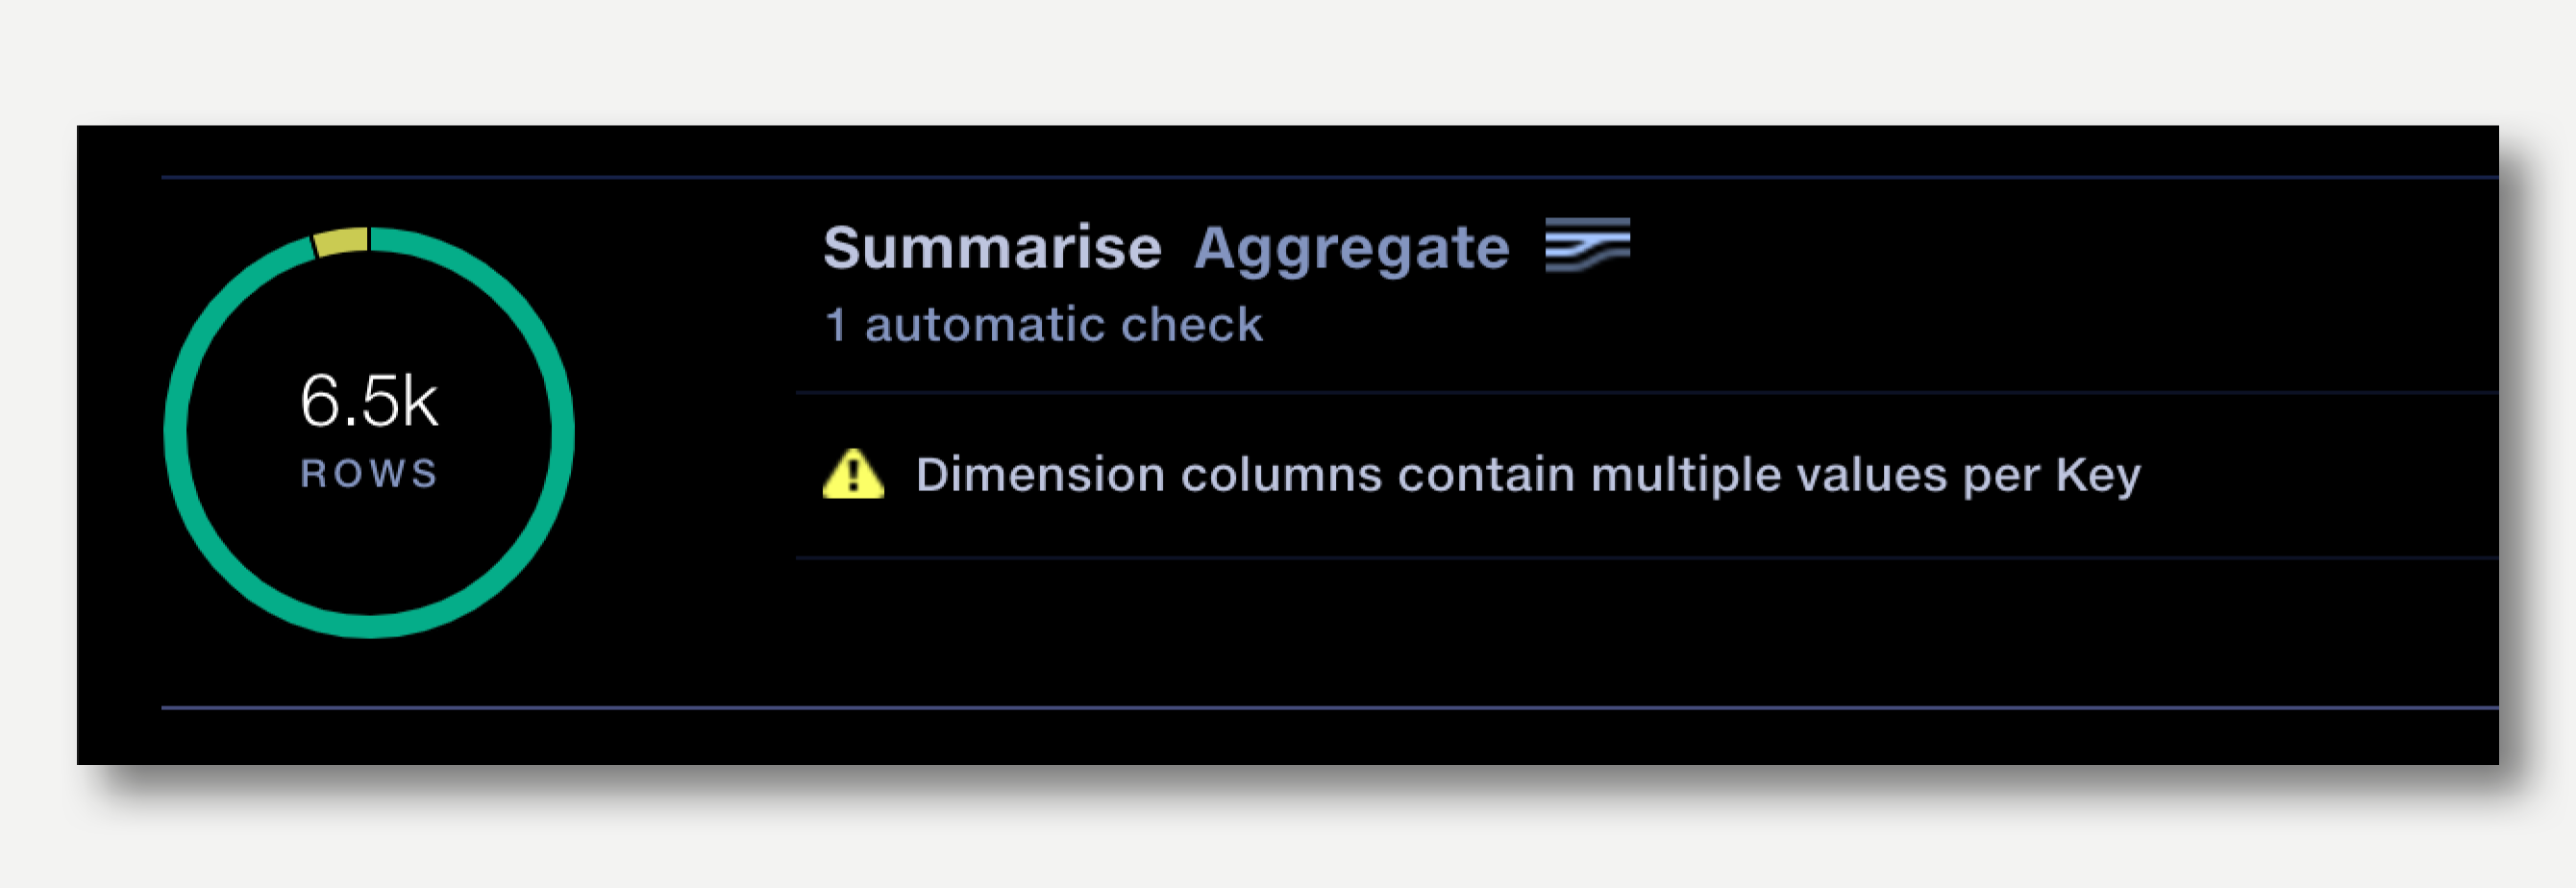
Clicking on the failure description drills down to show the un-merged rows, highlighting the dimension that stopped the merge.