Take precise control over the number formatting in your pivot tables.
Numbers in pivot tables are right-aligned by default
To set number formatting:
1.
Hover on the value header, a chevron appears.
2.
Click on the chevron to open the number formatting popup.
Number types
Number
Displays regular numbers.
Percent
Displays numbers as a percentage by multiplying by 100, e.g. 0.57 becomes 57%.
Select the number of decimal places to round to in the ‘Decimals’ window at the bottom of the popup.
Percentage formatting is particularly useful when displaying a calculated loss ratio.
Financial
Displays negative values in brackets.
% of total
Displays values as a percentage of the sum total of the
column. This is useful for conveying the relative size of values within a column. For instance
you may drag in a column ‘Profit’ and display it as a value, then drag in another instance of
‘Profit’ and display it as a ‘% of total’.
Note that since the total must always equal 100%, negative values
will be counted as their absolute values.
Magnitude
Simplify the display of your data by showing the numbers as Thousands,
Millions or Billions. Select the number of decimal places to round to in the ‘Decimals’ window
at the bottom of the popup. Hovering over the rounded number in the table shows the full value.
Alignment
Left, right or centre-align your numbers.
Decimals
Adjust the number of decimal places in the values displayed in this column.
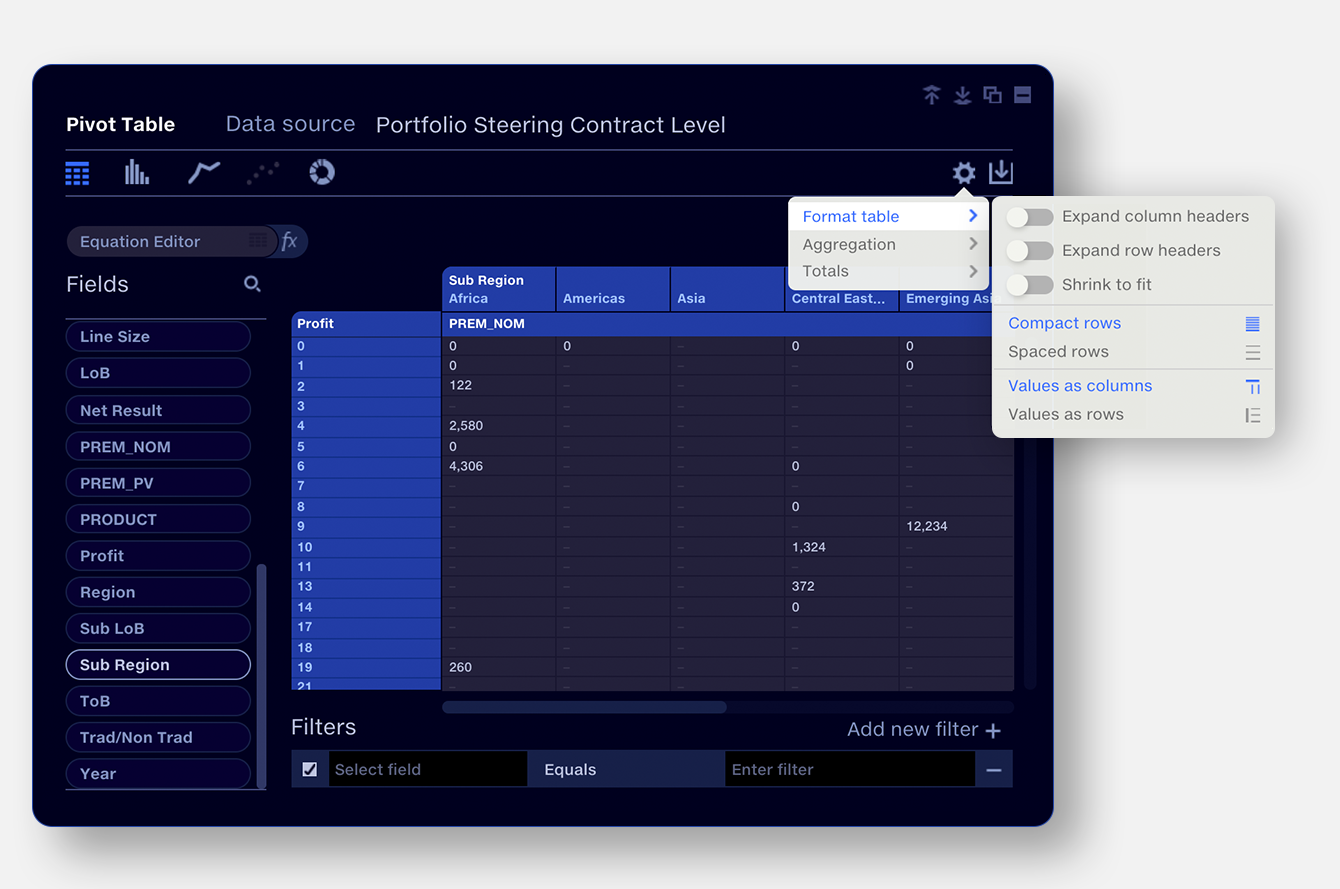
Table formatting
Apply table formatting via the table formatting popup.
Shrink to fit
Reduces the size of the pivot table to fit to the bounding box.
Shrink to fit is supported for table sizes up to thousands of cells, however
attempting to apply shrink to fit to extremely large tables may impair performance.
Compact rows
Reduces the row height to increase the amount of data that can fit to a page.
Expand column headers
View the full text of headers of column and row headers. Column
headers expand upwards, row headers expand outwards.
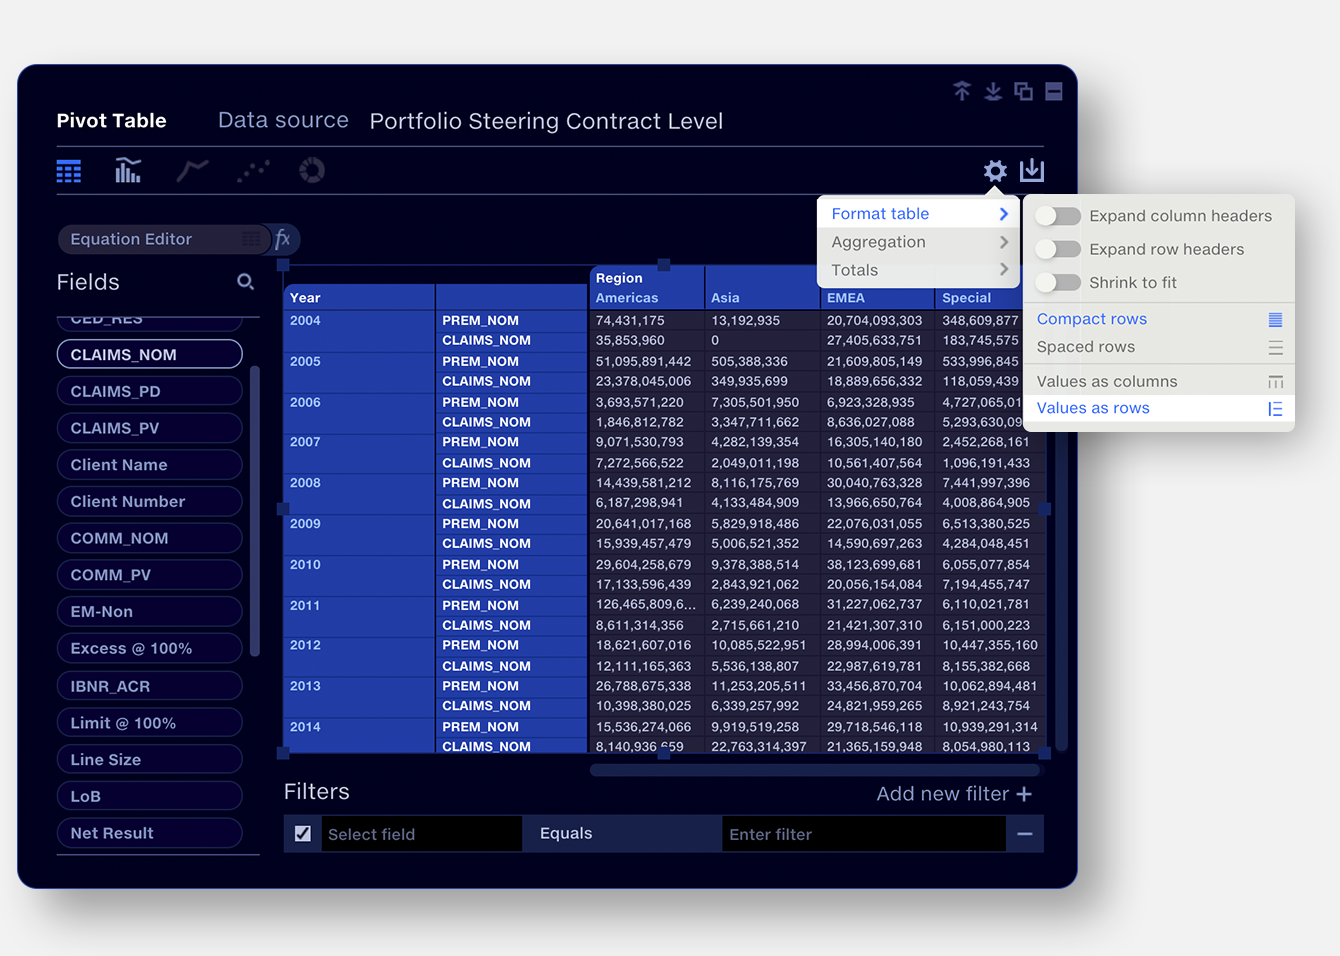
Values as columns
Displays the table values as columns. This is the default
setting for pivot tables.
Values as rows
Displays the table values as rows.
Aggregation
Each cell in a pivot table shows a segment of the raw data
derived from the categorisation options selected, aggregating the raw data to show
a single value. Different aggregation options show different aspects of the data.
Setting aggregation
Aggregation types
Sum
Sum total of values in each segment
Count
Number of values in each segment
Mean
Displays negative values in brackets
Min
Smallest value in each segment
Max
Largest value in each segment
Std Dev
Standard Deviation of values in each segment, i.e. the amount of variation in the values