
Quantemplate pipelines take raw input data, then cleanse, transform, validate and enrich it via user-defined operations.
This video shows you how to get started creating and running pipelines. For more detailed video walk-throughs, see Tutorials.
Quantemplate pipelines take datasets in unstructured/semi-structured
formats such as spreadsheets, transforming them into harmonised, structured data tables.
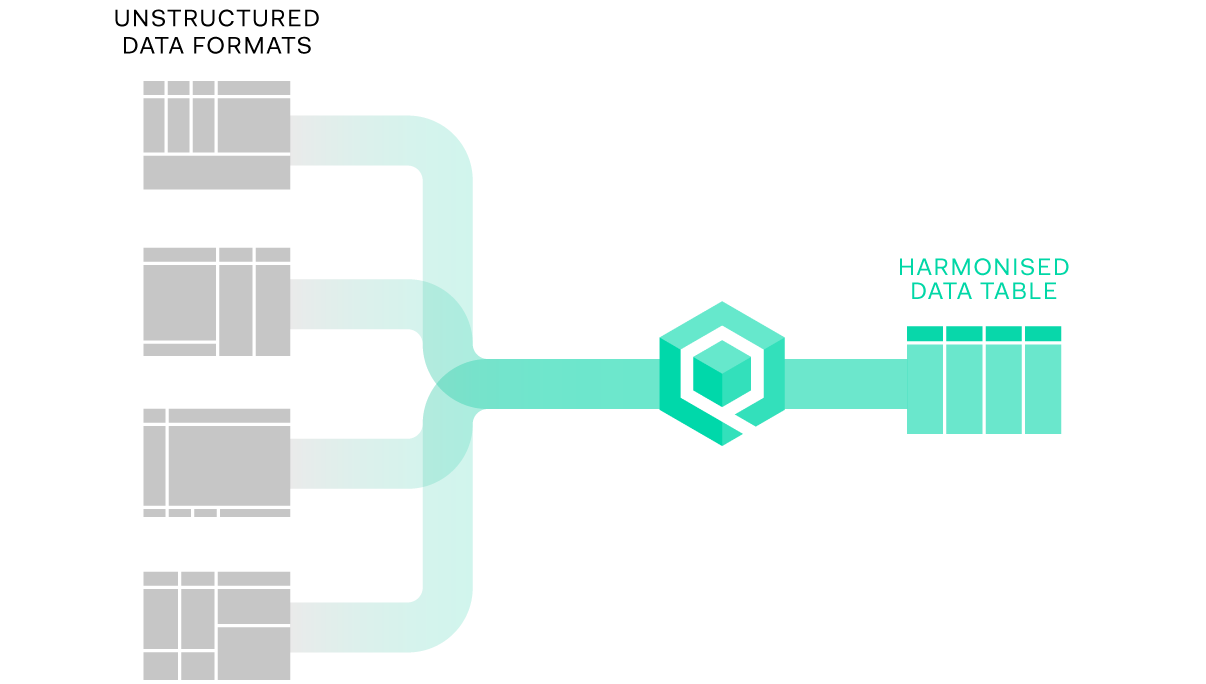

Data tables have a simple structure consisting of a set of columns and an unlimited number of rows.

Columns are the field names, represented as a set of headers at the top of a table.

Values are the individual data points. Quantemplate does not generally mandate a type of value (number, string, date) for a column, though certain functions require a certain value type:

Rows are collections of related data values, with one value for each column, usually represented as horizontal rows in Quantemplate.
Unlike spreadsheet tools such as Excel, Quantemplate pipelines apply a rules-based approach to configure batch processing actions across multiple datasets. This allows you to build repeatable processes to cleanse and harmonise data at scale.
Because it's built for defining data processing rules, Quantemplate pipelines do not allow:
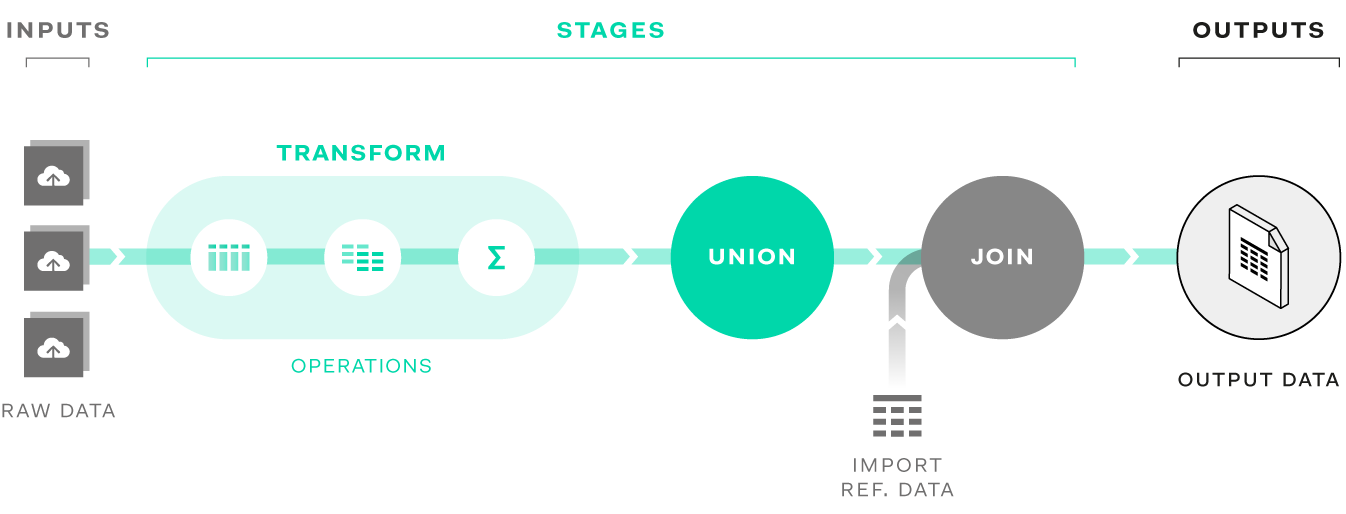
A pipeline is a data transformation process built for a set of input datasets, transforming them to a desired set of output datasets. A pipeline comprises:
Raw data for cleansing is uploaded directly via the inputs interface. Quantemplate supports data in XLS, XLSX, CSV and GZipped CSV formats. Cleansed data such as other pipeline outputs or reference codes can be stored in the Data tab and connected to a pipeline.
Data transformations are sequenced and configured via stages and operations. Stages are structural components with a defined number of input and output datasets, whilst operations are individual transformation process, grouped together in a transform stage. See Stages and operations for more details.
Each stage creates output datasets which are the result of the input data, modified by the operations within the stage. A stage’s output datasets can be connected to the inputs of a subsequent stage for further transformation, or can be exported to the Data tab, downloaded or shared with another organisation.
Pressing the run button executes the pipeline transformations and creates the output datasets. The inputs and output datasets from each run of the pipeline are retained, and can be previewed, exported or downloaded.